生成图表
如何分析用户的数据是一个有趣的问题,特别是当我们有大量的数据的时候。除了matlab,我们还可以用numpy+matplotlib
数据可以在这边寻找到
最后效果图
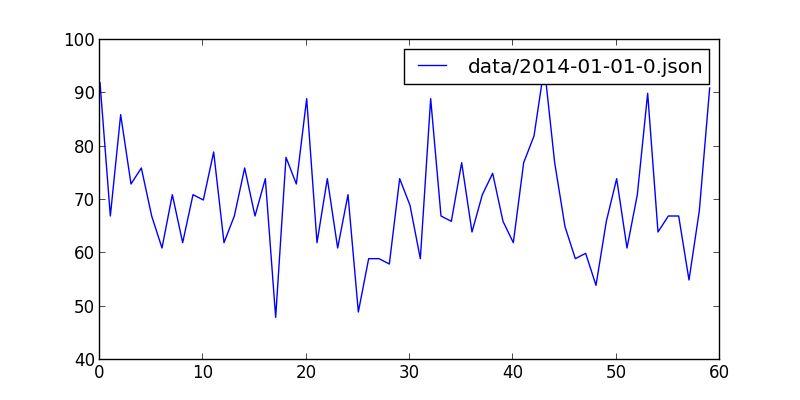 2014 01 01
要解析的json文件位于data/2014-01-01-0.json,大小6.6M,显然我们可能需要用每次只读一行的策略,这足以解释为什么诸如sublime打开的时候很慢,而现在我们只需要里面的json数据中的创建时间。。
==,这个文件代表什么?
2014年1月1日零时到一时,用户在github上的操作,这里的用户指的是很多。。一共有4814条数据,从commit、create到issues都有。
数据解析
import jsonfor line in open(jsonfile):line = f.readline()
然后再解析json
import dateutil.parserlin = json.loads(line)date = dateutil.parser.parse(lin["created_at"])
这里用到了dateutil,因为新鲜出炉的数据是string需要转换为dateutil,再到数据放到数组里头。最后有就有了parse_data
def parse_data(jsonfile):f = open(jsonfile, "r")dataarray = []datacount = 0for line in open(jsonfile):line = f.readline()lin = json.loads(line)date = dateutil.parser.parse(lin["created_at"])datacount += 1dataarray.append(date.minute)minuteswithcount = [(x, dataarray.count(x)) for x in set(dataarray)]f.close()return minuteswithcount
下面这句代码就是将上面的解析为
minuteswithcount = [(x, dataarray.count(x)) for x in set(dataarray)]
这样的数组以便于解析
[(0, 92), (1, 67), (2, 86), (3, 73), (4, 76), (5, 67), (6, 61), (7, 71), (8, 62), (9, 71), (10, 70), (11, 79), (12, 62), (13, 67), (14, 76), (15, 67), (16, 74), (17, 48), (18, 78), (19, 73), (20, 89), (21, 62), (22, 74), (23, 61), (24, 71), (25, 49), (26, 59), (27, 59), (28, 58), (29, 74), (30, 69), (31, 59), (32, 89), (33, 67), (34, 66), (35, 77), (36, 64), (37, 71), (38, 75), (39, 66), (40, 62), (41, 77), (42, 82), (43, 95), (44, 77), (45, 65), (46, 59), (47, 60), (48, 54), (49, 66), (50, 74), (51, 61), (52, 71), (53, 90), (54, 64), (55, 67), (56, 67), (57, 55), (58, 68), (59, 91)]
Matplotlib
开始之前需要安装``matplotlib
sudo pip install matplotlib
然后引入这个库
import matplotlib.pyplot as plt
如上面的那个结果,只需要
plt.figure(figsize=(8,4))plt.plot(x, y,label = files)plt.legend()plt.show()
最后代码可见
#!/usr/bin/env python# -*- coding: utf-8 -*-import jsonimport dateutil.parserimport numpy as npimport matplotlib.mlab as mlabimport matplotlib.pyplot as pltdef parse_data(jsonfile):f = open(jsonfile, "r")dataarray = []datacount = 0for line in open(jsonfile):line = f.readline()lin = json.loads(line)date = dateutil.parser.parse(lin["created_at"])datacount += 1dataarray.append(date.minute)minuteswithcount = [(x, dataarray.count(x)) for x in set(dataarray)]f.close()return minuteswithcountdef draw_date(files):x = []y = []mwcs = parse_data(files)for mwc in mwcs:x.append(mwc[0])y.append(mwc[1])plt.figure(figsize=(8,4))plt.plot(x, y,label = files)plt.legend()plt.show()draw_date("data/2014-01-01-0.json")
