每周分析
继上篇之后,我们就可以分析用户的每周提交情况,以得出用户的真正的工具效率,每个程序员的工作时间可能是不一样的,如
 Phodal Huang’s Report
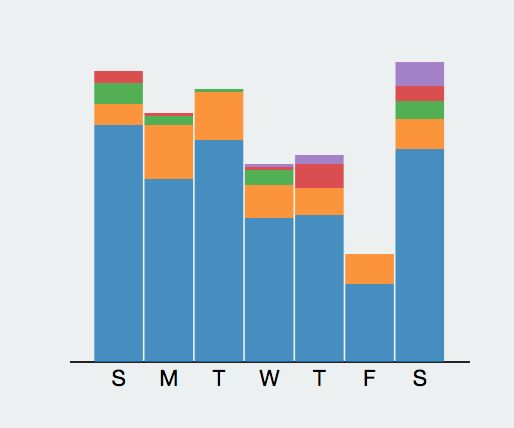
这是我的每周情况,显然如果把星期六移到前面的话,随着工作时间的增长,在github上的使用在下降,作为一个
a fulltime hacker who works best in the evening (around 8 pm).
不过这个是osrc的分析结果。
python github 每周情况分析
看一张分析后的结果
 Feb Results
结果正好与我的情况相反?似乎图上是这么说的,但是数据上是这样的情况。
data├── 2014-01-01-0.json├── 2014-02-01-0.json├── 2014-02-02-0.json├── 2014-02-03-0.json├── 2014-02-04-0.json├── 2014-02-05-0.json├── 2014-02-06-0.json├── 2014-02-07-0.json├── 2014-02-08-0.json├── 2014-02-09-0.json├── 2014-02-10-0.json├── 2014-02-11-0.json├── 2014-02-12-0.json├── 2014-02-13-0.json├── 2014-02-14-0.json├── 2014-02-15-0.json├── 2014-02-16-0.json├── 2014-02-17-0.json├── 2014-02-18-0.json├── 2014-02-19-0.json└── 2014-02-20-0.json
我们获取是每天晚上0点时的情况,至于为什么是0点,我想这里的数据量可能会比较少。除去1月1号的情况,就是上面的结果,在只有一周的情况时,总会以为因为在国内那时是假期,但是总觉得不是很靠谱,国内的程序员虽然很多,会在github上活跃的可能没有那么多,直至列出每一周的数据时。
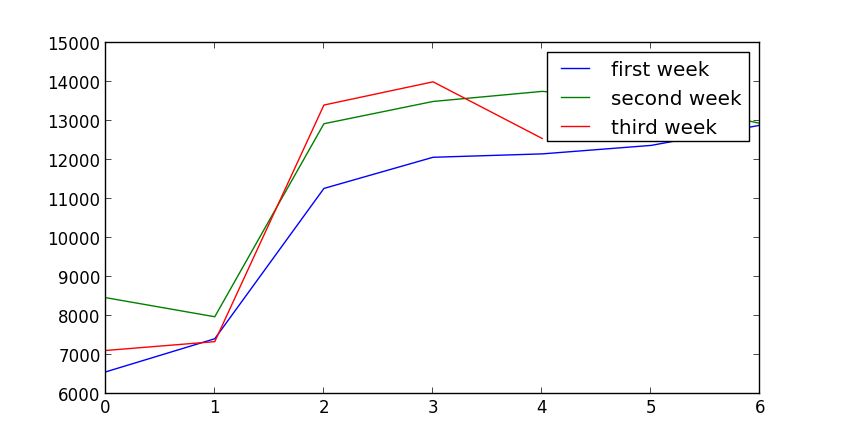
6570, 7420, 11274, 12073, 12160, 12378, 12897,8474, 7984, 12933, 13504, 13763, 13544, 12940,7119, 7346, 13412, 14008, 12555
Python 数据分析
重写了一个新的方法用于计算提交数,直至后面才意识到其实我们可以算行数就够了,但是方法上有点hack
def get_minutes_counts_with_id(jsonfile):datacount, dataarray = handle_json(jsonfile)minuteswithcount = [(x, dataarray.count(x)) for x in set(dataarray)]return minuteswithcountdef handle_json(jsonfile):f = open(jsonfile, "r")dataarray = []datacount = 0for line in open(jsonfile):line = f.readline()lin = json.loads(line)date = dateutil.parser.parse(lin["created_at"])datacount += 1dataarray.append(date.minute)f.close()return datacount, dataarraydef get_minutes_count_num(jsonfile):datacount, dataarray = handle_json(jsonfile)return datacountdef get_month_total():""":rtype : object"""monthdaycount = []for i in range(1, 20):if i < 10:filename = 'data/2014-02-0' + i.__str__() + '-0.json'else:filename = 'data/2014-02-' + i.__str__() + '-0.json'monthdaycount.append(get_minutes_count_num(filename))return monthdaycount
接着我们需要去遍历每个结果,后面的后面会发现这个效率真的是太低了,为什么木有多线程?
Python Matplotlib图表
让我们的matplotlib来做这些图表的工作
if __name__ == '__main__':results = pd.get_month_total()print resultsplt.figure(figsize=(8, 4))plt.plot(results.__getslice__(0, 7), label="first week")plt.plot(results.__getslice__(7, 14), label="second week")plt.plot(results.__getslice__(14, 21), label="third week")plt.legend()plt.show()
蓝色的是第一周,绿色的是第二周,蓝色的是第三周就有了上面的结果。
我们还需要优化方法,以及多线程的支持。
让我们分析之前的程序,然后再想办法做出优化。网上看到一篇文章http://www.huyng.com/posts/python-performance-analysis/讲的就是分析这部分内容的。
