Analytical Tools and Frameworks
 E HAVE SPENT THE PAST DECADE developing a set of analytical tools and frameworks in an attempt to make the formulation and execution of blue ocean strategy as systematic and actionable as competing in the red waters of known market space. These analytics fill a central void in the field of strategy, which has developed an impressive array of tools and frameworks to compete in red oceans, such as the five forces for analyzing existing industry conditions and three generic strategies, but has remained virtually silent on practical tools to excel in blue oceans. Instead, executives have received calls to be brave and entrepreneurial, to learn from failure, and to seek out revolutionaries. Although thought-provoking, these are not substitutes for analytics to navigate successfully in blue waters. In the absence of analytics, executives cannot be expected to act on the call to break out of existing competition. Effective blue ocean strategy should be about risk minimization and not risk taking.
To address this imbalance, we studied companies around the world and developed practical methodologies in the quest of blue oceans. We then applied and tested these tools and frameworks in action by working with companies in their pursuit of blue oceans, enriching and refining them in the process. The tools and frameworks presented here are used throughout this book as we discuss the six principles of formulating and executing blue ocean strategy. As a brief introduction to these tools and frameworks, let's look at one industry the U.S. wine industry to see how these tools can be applied in practice in the creation of blue oceans.
The United States has the third largest aggregate consumption of wine worldwide. Yet the $20 billion industry is intensely competitive. California wines dominate the domestic market, capturing two-thirds of all U.S. wine sales. These wines compete head-to-head with imported wines from France, Italy, and Spain and New World wines from countries such as Chile, Australia, and Argentina, which have increasingly targeted the U.S. market. With the supply of wines increasing from Oregon, Washington, and New York state and with newly mature vineyard plantings in California, the number of wines has exploded. Yet the U.S. consumer base has essentially remained stagnant. The United States remains stuck at thirty-first place in world per capita wine consumption.
The intense competition has fueled ongoing industry consolidation. The top eight companies produce more than 75 percent of the wine in the United States, and the estimated one thousand six hundred other wineries produce the remaining 25 percent. The dominance of a few key players allows them to leverage distributors to gain shelf space and put millions of dollars into above-the-line marketing budgets. There is a simultaneous consolidation of retailers and distributors across the United States, something that raises their bargaining power against the plethora of wine makers. Titanic battles are being fought for retail and distribution space. It is no surprise that weak, poorly run companies are increasingly being swept aside. Downward pressure on wine prices has set in.
In short, the U.S. wine industry faces intense competition, mounting price pressure, increasing bargaining power on the part of retail and distribution channels, and flat demand despite overwhelming choice. Following conventional strategic thinking, the industry is hardly attractive. For strategists, the critical question is, How do you break out of this red ocean of bloody competition to make the competition irrelevant? How do you open up and capture a blue ocean of uncontested market space?
To address these questions, we turn to the strategy canvas, an analytic framework that is central to value innovation and the creation of blue oceans.
The Strategy Canvas
The strategy canvas is both a diagnostic and an action framework for building a compelling blue ocean strategy. It serves two purposes. First, it captures the current state of play in the known market space. This allows you to understand where the competition is currently investing, the factors the industry currently competes on in products, service, and delivery, and what customers receive from the existing competitive offerings on the market. Figure 2-1 captures all this information in graphic form. The horizontal axis captures the range of factors the industry competes on and invests in.
In the case of the U.S. wine industry, there are seven principal factors:
• Price per bottle of wine
• An elite, refined image in packaging, including labels announcing the wine medals won and the use of esoteric enological terminology to stress the art and science of wine making
• Above-the-line marketing to raise consumer awareness in a crowded market and to encourage distributors and retailers to give prominence to a particular wine house
FIGURE 2-1

The Strategy Canvas of the U.S. Wine Industry in the Late 1990s
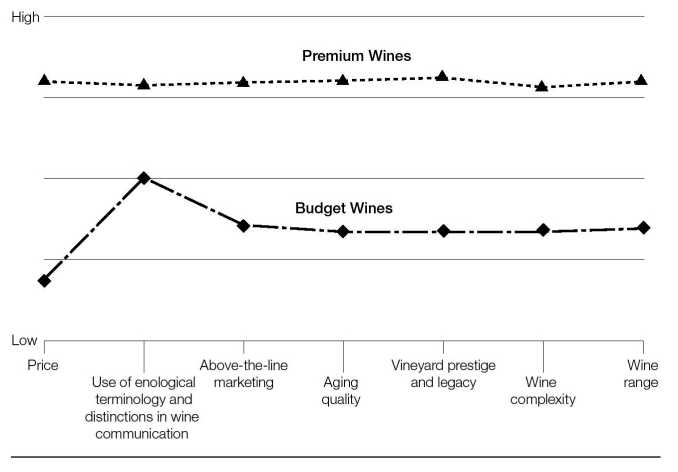
• Aging quality of wine
• The prestige of a wine's vineyard and its legacy (hence the appellations of estates and chateaux and references to the historic age of the establishment)
• The complexity and sophistication of a wine's taste, including such things as tannins and oak
• A diverse range of wines to cover all varieties of grapes and consumer preferences from Chardonnay to Merlot, and so on
These factors are viewed as key to the promotion of wine as a unique beverage for the informed wine drinker, worthy of special occasions.
That is the underlying structure of the U.S. wine industry from the market perspective. Now let's turn to the vertical axis of the strategy canvas, which captures the offering level that buyers receive across all these key competing factors. A high score means that a company offers buyers more, and hence invests more, in that factor. In the case of price, a higher score indicates a higher price. We can now plot the current offering of wineries across all these factors to understand wineries' strategic profiles, or value curves. The value curve, the basic component of the strategy canvas, is a graphic depiction of a company's relative performance across its industry's factors of competition.
Figure 2-1 shows that, although more than one thousand six hundred wineries participate in the U.S. wine industry, from the buyer's point of view there is enormous convergence in their value curves. Despite the plethora of competitors, when premium brand wines are plotted on the strategy canvas we discover that from the market point of view all of them essentially have the same strategic profile. They offer a high price and present a high level of offering across all the key competing factors. Their strategic profile follows a classic differentiation strategy. From the market point of view, however, they are all different in the same way. On the other hand, budget wines also have the same essential strategic profile. Their price is low, as is their offering across all the key competing factors. These are classic low-cost players. Moreover, the value curves of premium and low-cost wines share the same basic shape. The two strategic groups' strategies march in lockstep, but at different altitudes of offering level.
To set a company on a strong, profitable growth trajectory in the face of these industry conditions, it won't work to benchmark competitors and try to outcompete them by offering a little more for a little less. Such a strategy may nudge sales up but will hardly drive a company to open up uncontested market space. Nor is conducting extensive customer research the path to blue oceans. Our research found that customers can scarcely imagine how to create uncontested market space. Their insight also tends toward the familiar "offer me more for less." And what customers typically want "more" of are those product and service features that the industry currently offers.
To fundamentally shift the strategy canvas of an industry, you must begin by reorienting your strategic focus from competitors to alternatives, and from customers to noncustomers of the industry.' To pursue both value and cost, you should resist the old logic of benchmarking competitors in the existing field and choosing between differentiation and cost leadership. As you shift your strategic focus from current competition to alternatives and noncustomers, you gain insight into how to redefine the problem the industry focuses on and thereby reconstruct buyer value elements that reside across industry boundaries. Conventional strategic logic, by contrast, drives you to offer better solutions than your rivals to existing problems defined by your industry.
In the case of the U.S. wine industry, conventional wisdom caused wineries to focus on overdelivering on prestige and the quality of wine at its price point. Overdelivery meant adding complexity to the wine based on taste profiles shared by wine makers and reinforced by the wine show judging system. Wine makers, show judges, and knowledgeable drinkers concur that complexity layered personality and characteristics that reflect the uniqueness of the soil, season, and wine maker's skill in tannins, oak, and aging processes-equates with quality.
By looking across alternatives, however, Casella Wines, an Australian winery, redefined the problem of the wine industry to a new one: how to make a fun and nontraditional wine that's easy to drink for everyone. Why? In looking at the demand side of the alternatives of beer, spirits, and ready-to-drink cocktails, which captured three times as many U.S. consumer alcohol sales as wine, Casella Wines found that the mass of American adults saw wine as a turnoff. It was intimidating and pretentious, and the complexity of wine's taste created flavor challenges for the average person even though it was the basis on which the industry fought to excel. With this insight, Casella Wines was ready to explore how to redraw the strategic profile of the U.S. wine industry to create a blue ocean. To achieve this, it turned to the second basic analytic underlying blue oceans: the four actions framework.
The Four Actions Framework
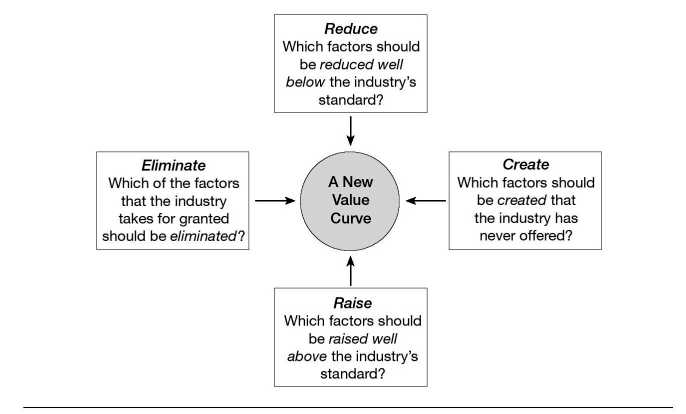
To reconstruct buyer value elements in crafting a new value curve, we have developed the four actions framework. As shown in figure 2-2, to break the trade-off between differentiation and low cost and to create a new value curve, there are four key questions to challenge an industry's strategic logic and business model:
• Which of the factors that the industry takes for granted should be eliminated?
• Which factors should be reduced well below the industry's standard?
• Which factors should be raised well above the industry's standard?
• Which factors should be created that the industry has never offered?
FIGURE 2-2

The Four Actions Framework
The first question forces you to consider eliminating factors that companies in your industry have long competed on. Often those factors are taken for granted even though they no longer have value or may even detract from value. Sometimes there is a fundamental change in what buyers value, but companies that are focused on benchmarking one another do not act on, or even perceive, the change.
The second question forces you to determine whether products or services have been overdesigned in the race to match and beat the competition. Here, companies overserve customers, increasing their cost structure for no gain.
The third question pushes you to uncover and eliminate the compromises your industry forces customers to make. The fourth question helps you to discover entirely new sources of value for buyers and to create new demand and shift the strategic pricing of the industry.
It is by pursuing the first two questions (of eliminating and reducing) that you gain insight into how to drop your cost structure vis-a-vis competitors. Our research has found that rarely do managers systematically set out to eliminate and reduce their investments in factors that an industry competes on. The result is mounting cost structures and complex business models. The second two factors, by contrast, provide you with insight into how to lift buyer value and create new demand. Collectively, they allow you to systematically explore how you can reconstruct buyer value elements across alternative industries to offer buyers an entirely new experience, while simultaneously keeping your cost structure low. Of particular importance are the actions of eliminating and creating, which push companies to go beyond value maximization exercises with existing factors of competition. Eliminating and creating prompt companies to change the factors themselves, hence making the existing rules of competition irrelevant.
When you apply the four actions framework to the strategy canvas of your industry, you get a revealing new look at old perceived truths. In the case of the U.S. wine industry, by thinking in terms of these four actions vis-a-vis the current industry logic and looking across alternatives and noncustomers, Casella Wines created [yellow tail], a wine whose strategic profile broke from the competition and created a blue ocean. Instead of offering wine as wine, Casella created a social drink accessible to everyone: beer drinkers, cocktail drinkers, and other drinkers of nonwine beverages. In the space of two years, the fun, social drink [yellow tail] emerged as the fastest growing brand in the histories of both the Australian and the U.S. wine industries and the number one imported wine into the United States, surpassing the wines of France and Italy. By August 2003 it was the number one red wine in a 750-ml bottle sold in the United States, outstripping California labels. By mid-2003, [yellow tail]'s moving average annual sales were tracking at 4.5 million cases. In the context of a global wine glut, [yellow tail] has been racing to keep up with sales.
What's more, whereas large wine companies developed strong brands over decades of marketing investment, [yellow tail] leapfrogged tall competitors with no promotional campaign, mass media, or consumer advertising. It didn't simply steal sales from competitors; it grew the market. [yellow tail] brought nonwine drinkers beer and ready-to-drink cocktail consumers into the wine market. Moreover, novice table wine drinkers started to drink wine more frequently, jug wine drinkers moved up, and drinkers of more expensive wines moved down to become consumers of [yellow tail].
Figure 2-3 shows the extent to which the application of these four actions led to a break from the competition in the U.S. wine industry. Here we can graphically compare [yellow tail]'s blue ocean strategy with the more than one thousand six hundred wineries competing in the United States. As shown in figure 2-3, [yellow tail]'s value curve stands apart. Casella Wines acted on all four actions—eliminate, reduce, raise, and create-to unlock uncontested market space that changed the face of the U.S. wine industry in a span of two years.
By looking at the alternatives of beer and ready-to-drink cocktails and thinking in terms of noncustomers, Casella Wines created three new factors in the U.S. wine industry easy drinking, easy to select, and fun and adventure and eliminated or reduced everything else. Casella Wines found that the mass of Americans rejected wine because its complicated taste was difficult to appreciate. Beer and ready-to-drink cocktails, for example, were much sweeter and easier to drink. Accordingly, [yellow tail] was a completely new combination of wine characteristics that produced an uncomplicated wine structure that was instantly appealing to the mass of alcohol drinkers. The wine was soft in taste and approachable like ready-to-drink cocktails and beer, and had up-front, primary flavors and pronounced fruit flavors. The sweet fruitiness of the wine also kept people's palate fresher, allowing them to enjoy another glass of wine without thinking about it. The result was an easydrinking wine that did not require years to develop an appreciation for.
FIGURE 2-3

The Strategy Canvas of [yellow tail]
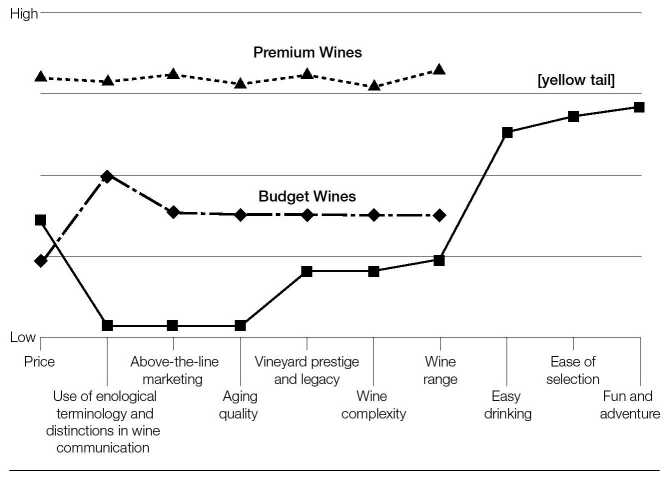
In line with this simple fruity sweetness, [yellow tail] dramatically reduced or eliminated all the factors the wine industry had long competed on tannins, oak, complexity, and aging in crafting fine wine, whether it was for the premium or the budget segment. With the need for aging eliminated, the needed working capital for aging wine at Casella Wines was also reduced, creating a faster payback for the wine produced. The wine industry criticized the sweet fruitiness of [yellow tail] wine, seeing it as significantly lowering the quality of wine and working against proper appreciation of fine grapes and historic wine craftsmanship. These claims may have been true, but customers of all sorts loved the wine.
Wine retailers in the United States offered buyers aisles of wine varieties, but to the general consumer the choice was overwhelming and intimidating. The bottles looked the same, labels were complicated with enological terminology understandable only to the wine connoisseur or hobbyist, and the choice was so extensive that salesclerks at retail shops were at an equal disadvantage in understanding or recommending wine to bewildered potential buyers. Moreover, the rows of wine choice fatigued and demotivated customers, making selection a difficult process that left the average wine purchaser insecure with the choice.
[yellow tail] changed all that by creating ease of selection. It dramatically reduced the range of wines offered, creating only two: Chardonnay, the most popular white in the United States, and a red, Shiraz. It removed all technical jargon from the bottles and created instead a striking, simple, and nontraditional label featuring a kangaroo in bright, vibrant colors of orange and yellow on a black background. The wine boxes [yellow tail] came in were also of the same vibrant colors, with the name [yellow tail] printed boldly on the sides; the boxes served the dual purpose of acting as eyecatching, unintimidating displays for the wine.
[yellow tail] hit a home run in ease of selection when it made retail shop employees the ambassadors of [yellow tail] by giving them Australian outback clothing, including bushman's hats and oilskin jackets to wear at work. The retail employees were inspired by the branded clothing and having a wine they themselves did not feel intimidated by, and recommendations to buy [yellow tail] flew out of their mouths. In short, it was fun to recommend [yellow tail].
The simplicity of offering only two wines at the start -a red and a white streamlined Casella Wines' business model. Minimizing the stockkeeping units maximized its stock turnover and minimized investment in warehouse inventory. In fact, this reduction of variety was carried over to the bottles inside the cases. [yellow tail] broke industry conventions. Casella Wines was the first company to put both red and white wine in the same-shaped bottle, a practice that created further simplicity in manufacturing and purchasing and resulted in stunningly simple wine displays.
The wine industry worldwide was proud to promote wine as a refined beverage with a long history and tradition. This is reflected in the target market for the United States: educated professionals in the upper income brackets. Hence, the continuous focus on the quality and legacy of the vineyard, the chateau's or estate's historical tradition, and the wine medals won. Indeed the growth strategies of the major players in the U.S. wine industry were targeted at the premium end of the market, with tens of millions invested in brand advertising to strengthen this image. By looking to beer and ready-to-drink cocktail customers, however, [yellow tail] found that this elite image did not resonate with the general public, which found it intimidating. So [yellow tail] broke with tradition and created a personality that embodied the characteristics of the Australian culture: bold, laid back, fun, and adventurous. Approachability was the mantra: "The essence of a great land … Australia." There was no traditional winery image. The lowercase spelling of the name [yellow tail], coupled with the vibrant colors and the kangaroo motif, echoed Australia. And indeed no reference to the vineyard was made on the bottle. The wine promised to jump from the glass like an Aussie kangaroo.
The result is that [yellow tail] appealed to a broad cross section of alcohol beverage consumers. By offering this leap in value, [yel low tail] raised the price of its wines above the budget market, pricing them at $6.99 a bottle, more than double the price of a jug wine. From the moment the wine hit the retail shelves in July 2001, sales took off.
The Eliminate-Reduce-Raise-Create Grid
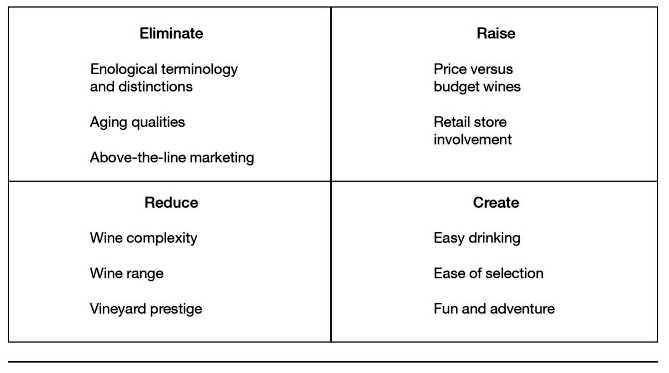
There is a third tool that is key to creation of blue oceans. It is a supplementary analytic to the four actions framework called the eliminate-reduce-raise-create grid (see figure 2-4). The grid pushes companies not only to ask all four questions in the four actions framework but also to act on all four to create a new value curve. By driving companies to fill in the grid with the actions of eliminating and reducing as well as raising and creating, the grid gives companies four immediate benefits:
• It pushes them to simultaneously pursue differentiation and low costs to break the valuecost trade-off.
FIGURE 2-4

Eliminate-Reduce-Raise-Create Grid: The Case of [yellow tail]
• It immediately flags companies that are focused only on raising and creating and thereby lifting their cost structure and often overengineering products and services -a common plight in many companies.
• It is easily understood by managers at any level, creating a high level of engagement in its application.
• Because completing the grid is a challenging task, it drives companies to robustly scrutinize every factor the industry competes on, making them discover the range of implicit assumptions they make unconsciously in competing.
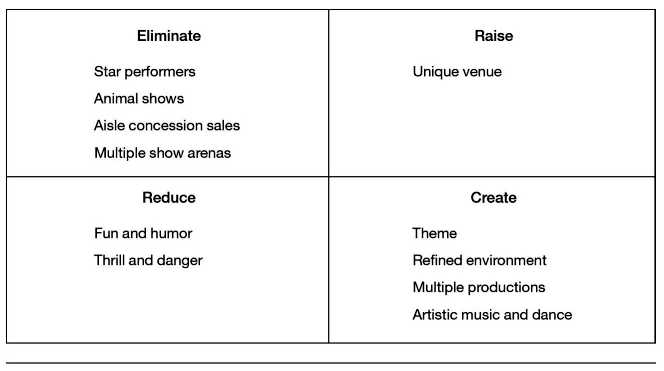
Figure 2-5, the eliminate-reduce-raise-create grid for Cirque du Soleil, provides another snapshot of this tool in action and shows what it reveals. Worth noting is the range of factors that an industry has long competed on that companies discover can be eliminated and reduced. In the case of Cirque du Soleil, it eliminated several factors from traditional circuses, such as animal shows, star performers, and multiple show arenas. These factors had long been taken for granted in the traditional circus industry, which never questioned their ongoing relevance. However, there was increasing public discomfort with the use of animals. Moreover, animal acts are one of the most expensive elements; not only is there the cost of the animals, but also their training, medical care, housing, insurance, and transportation. Similarly, although the circus industry focused on featuring stars, in the mind of the public the socalled stars of the circus were trivial next to movie stars. Again, they were a high-cost component carrying little sway with spectators. Gone, too, are three-ring venues. Not only did these create angst among spectators as they rapidly switched their gaze from one ring to the other, but they also increased the number of performers needed, with the obvious cost implications.
FIGURE 2-5
Eliminate-Reduce-Raise-Create Grid: The Case of Cirque du Soleil
Three Characteristics of a Good Strategy
[yellow tail], like Cirque du Soleil, created a unique and exceptional value curve to unlock a blue ocean. As shown in the strategy canvas, [yellow tail]'s value curve has focus; the company does not diffuse its efforts across all key factors of competition. The shape of its value curve diverges from the other players', a result of not benchmarking competitors but instead looking across alternatives. The tagline of [yellow tail]'s strategic profile is clear: a fun and simple wine to be enjoyed every day.
When expressed through a value curve, then, an effective blue ocean strategy like [yellow tail]'s has three complementary qualities: focus, divergence, and a compelling tagline. Without these qualities, a company's strategy will likely be muddled, undifferentiated, and hard to communicate with a high cost structure. The four actions of creating a new value curve should be well guided toward building a company's strategic profile with these characteristics. These three characteristics serve as an initial litmus test of the commercial viability of blue ocean ideas.
FIGURE 2-6

The Strategy Canvas of Southwest Airlines
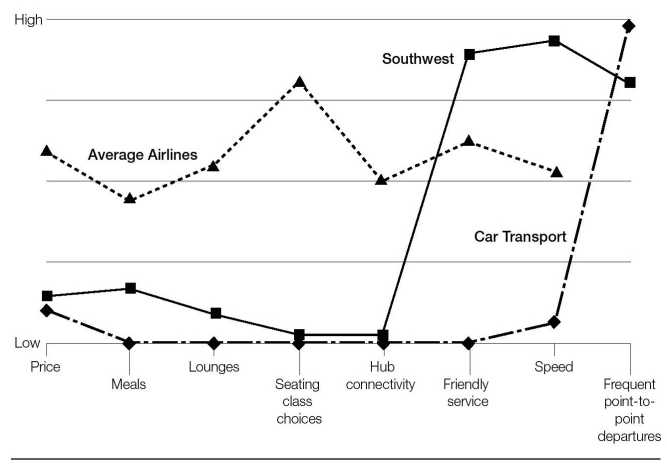
A look at Southwest Airlines' strategic profile illustrates how these three qualities underlie the company's effective strategy in reinventing the short-haul airline industry via value innovation (see figure 2-6). Southwest Airlines created a blue ocean by breaking the trade-offs customers had to make between the speed of airplanes and the economy and flexibility of car transport. To achieve this, Southwest offered high-speed transport with frequent and flexible departures at prices attractive to the mass of buyers. By eliminating and reducing certain factors of competition and raising others in the traditional airline industry, as well as by creating new factors drawn from the alternative industry of car transport, Southwest Airlines was able to offer unprecedented utility for air travelers and achieve a leap in value with a low-cost business model.
The value curve of Southwest Airlines differs distinctively from those of its competitors in the strategy canvas. Its strategic profile is a typical example of a compelling blue ocean strategy.
Focus
Every great strategy has focus, and a company's strategic profile, or value curve, should clearly show it. Looking at Southwest's profile, we can see at once that the company emphasizes only three factors: friendly service, speed, and frequent pointto-point departures. By focusing in this way, Southwest has been able to price against car transportation; it doesn't make extra investments in meals, lounges, and seating choices. By contrast, Southwest's traditional competitors invest in all the airline industry's competitive factors, making it much more difficult for them to match Southwest's prices. Investing across the board, these companies let their competitors' moves set their own agendas. Costly business models result.
Divergence
When a company's strategy is formed reactively as it tries to keep up with the competition, it loses its uniqueness. Consider the similarities in most airlines' meals and business-class lounges. On the strategy canvas, therefore, reactive strategists tend to share the same strategic profile. Indeed, in the case of Southwest, the value curves of the company's competitors are virtually identical and therefore can be summarized on the strategy canvas with a single value curve.
In contrast, the value curves of blue ocean strategists always stand apart. By applying the four actions of eliminating, reducing, raising, and creating, they differentiate their profiles from the industry's average profile. Southwest, for example, pioneered pointto-point travel between midsize cities; previously, the industry operated through hub-and-spoke systems.
Compelling Tagline
A good strategy has a clear-cut and compelling tagline. "The speed of a plane at the price of a car whenever you need it." That's the tagline of Southwest Airlines, or at least it could be. What could Southwest's competitors say? Even the most proficient ad agency would have difficulty reducing the conventional offering of lunches, seat choices, lounges, and hub links, with standard service, slower speeds, and higher prices into a memorable tagline. A good tagline must not only deliver a clear message but also advertise an offering truthfully, or else customers will lose trust and interest. In fact, a good way to test the effectiveness and strength of a strategy is to look at whether it contains a strong and authentic tagline.
As shown in figure 2-7, Cirque du Soleil's strategic profile also meets the three criteria that define blue ocean strategy: focus, divergence, and a compelling tagline. Cirque du Soleil's strategy canvas allows us to graphically compare its strategic profile with those of its major competitors. The canvas shows clearly the extent of Cirque du Soleil's departure from the conventional logic of the circus. The figure shows that the value curve of Ringling Bros. and Barnum & Bailey is the same basic shape as those of smaller regional circuses. The main difference is that regional circuses
FIGURE 2-7

The Strategy Canvas of Cirque du Soleil
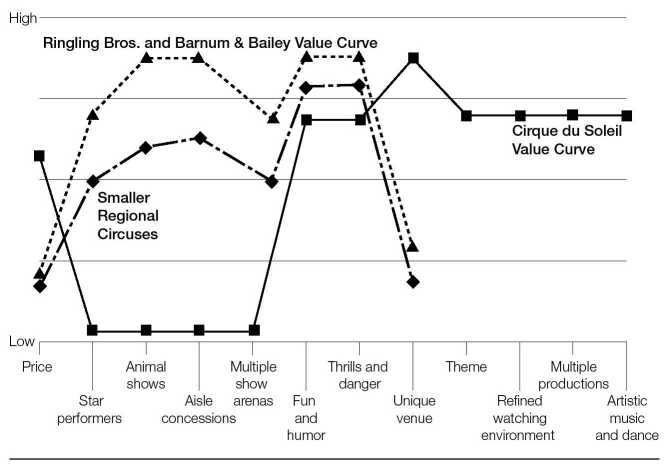
offer less of each competing factor because of their restricted resources.
By contrast, Cirque du Soleil's value curve stands apart. It has new and noncircus factors such as theme, multiple productions, refined watching environment, and artistic music and dance. These factors, entirely new creations for the circus industry, are drawn from the alternative live entertainment industry of theater. In this way, the strategy canvas clearly depicts the traditional factors that affect competition among industry players, as well as new factors that lead to creation of new market space and that shift the strategy canvas of an industry.
[yellow tail], Cirque du Soleil, and Southwest Airlines created blue oceans in very different business situations and industrial contexts. However, their strategic profiles shared the same three characteristics: focus, divergence, and a compelling tagline. These three criteria guide companies in carrying out the process of reconstruction to arrive at a breakthrough in value both for buyers and for themselves.
Reading the Value Curves
The strategy canvas enables companies to see the future in the present. To achieve this, companies must understand how to read value curves. Embedded in the value curves of an industry is a wealth of strategic knowledge on the current status and future of a business.
A Blue Ocean Strategy
The first question the value curves answer is whether a business deserves to be a winner. When a company's value curve, or its competitors', meets the three criteria that define a good blue ocean strategy focus, divergence, and a compelling tagline that speaks to the market the company is on the right track. These three criteria serve as an initial litmus test of the commercial viability of blue ocean ideas.
On the other hand, when a company's value curve lacks focus, its cost structure will tend to be high and its business model complex in implementation and execution. When it lacks divergence, a company's strategy is a me-too, with no reason to stand apart in the marketplace. When it lacks a compelling tagline that speaks to buyers, it is likely to be internally driven or a classic example of innovation for innovation's sake with no great commercial potential and no natural takeoff capability.
A Company Caught in the Red Ocean
When a company's value curve converges with its competitors, it signals that a company is likely caught within the red ocean of bloody competition. A company's explicit or implicit strategy tends to be trying to outdo its competition on the basis of cost or quality. This signals slow growth unless, by the grace of luck, the company benefits from being in an industry that is growing on its own accord. This growth is not due to a company's strategy, however, but to luck.
Overdelivery Without Payback
When a company's value curve on the strategy canvas is shown to deliver high levels across all factors, the question is, Does the company's market share and profitability reflect these investments? If not, the strategy canvas signals that the company may be oversupplying its customers, offering too much of those elements that add incremental value to buyers. To valueinnovate, the company must decide which factors to eliminate and reduce and not only those to raise and create-to construct a divergent value curve.
An Incoherent Strategy
When a company's value curve looks like a bowl of spaghetti -a zigzag with no rhyme or reason, where the offering can be described as "low-high-low-low-high-low-high" it signals that the company doesn't have a coherent strategy. Its strategy is likely based on independent substrategies. These may individually make sense and keep the business running and everyone busy, but collectively they do little to distinguish the company from the best competitor or to provide a clear strategic vision. This is often a reflection of an organization with divisional or functional silos.
Strategic Contradictions
Are there strategic contradictions? These are areas where a company is offering a high level on one competing factor while ignoring others that support that factor. An example is investing heavily in making a company's Web site easy to use but failing to correct the site's slow speed of operation. Strategic inconsistencies can also be found between the level of your offering and your price. For example, a petroleum station company found that it offered "less for more": fewer services than the best competitor at a higher price. No wonder it was losing market share fast.
An Internally Driven Company
In drawing the strategy canvas, how does a company label the industry's competing factors? For example, does it use the word megahertz instead of speed, or thermal water temperature instead of hot water? Are the competing factors stated in terms buyers can understand and value, or are they in operational jargon? The kind of language used in the strategy canvas gives insight as to whether a company's strategic vision is built on an "outside-in" perspective, driven by the demand side, or an "inside-out" perspective that is operationally driven. Analyzing the language of the strategy canvas helps a company understand how far it is from creating industry demand.
The tools and frameworks introduced here are essential analytics used throughout this book, and supplementary tools are introduced in other chapters as needed. It is the intersection between these analytic techniques and the six principles of formulating and executing blue oceans that allow companies to break from the competition and unlock uncontested market space.
Now we move on to the first principle, reconstructing market boundaries. In the next chapter we discuss the opportunity-maximizing and riskminimizing paths to creating blue oceans.
