Get the Strategic Sequence Right
 !OU'VE LOOKED ACROSS PATHS to discover possible blue oceans. You've constructed a strategy canvas that clearly articulates your future blue ocean strategy. And you have explored how to aggregate the largest possible mass of buyers for your idea. The next challenge is to build a robust business model to ensure that you make a healthy profit on your blue ocean idea. This brings us to the fourth principle of blue ocean strategy: Get the strategic sequence right.
This chapter discusses the strategic sequence of fleshing out and validating blue ocean ideas to ensure their commercial viability. With an understanding of the right strategic sequence and of how to assess blue ocean ideas along the key criteria in that sequence, you dramatically reduce business model risk.
The Right Strategic Sequence
As shown in figure 6-1, companies need to build their blue ocean strategy in the sequence of buyer utility, price, cost, and adoption.
FIGURE 6-1

The Sequence of Blue Ocean Strategy
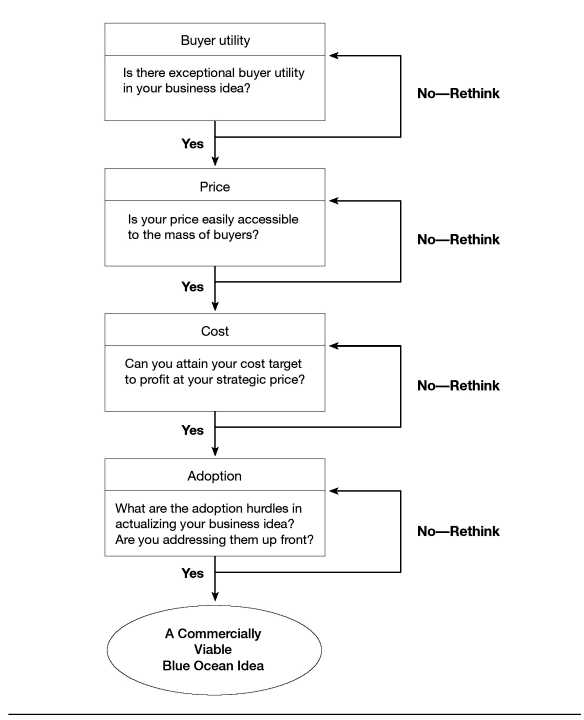
The starting point is buyer utility. Does your offering unlock exceptional utility? Is there a compelling reason for the mass of people to buy it? Absent this, there is no blue ocean potential to begin with. Here there are only two options. Park the idea, or rethink it until you reach an affirmative answer.
When you clear the exceptional utility bar, you advance to the second step: setting the right strategic price. Remember, a company does not want to rely solely on price to create demand. The key question here is this: Is your offering priced to attract the mass of target buyers so that they have a compelling ability to pay for your offering? If it is not, they cannot buy it. Nor will the offering create irresistible market buzz.
These first two steps address the revenue side of a company's business model. They ensure that you create a leap in net buyer value, where net buyer value equals the utility buyers receive minus the price they pay for it.
Securing the profit side brings us to the third element: cost. Can you produce your offering at the target cost and still earn a healthy profit margin? Can you profit at the strategic price the price easily accessible to the mass of target buyers? You should not let costs drive prices. Nor should you scale down utility because high costs block your ability to profit at the strategic price. When the target cost cannot be met, you must either forgo the idea because the blue ocean won't be profitable, or you must innovate your business model to hit the target cost. The cost side of a company's business model ensures that it creates a leap in value for itself in the form of profit that is, the price of the offering minus the cost of production. It is the combination of exceptional utility, strategic pricing, and target costing that allows companies to achieve value innovation -a leap in value for both buyers and companies.
The last step is to address adoption hurdles. What are the adoption hurdles in rolling out your idea? Have you addressed these up front? The formulation of blue ocean strategy is complete only when you can address adoption hurdles in the beginning to ensure the successful actualization of your idea. Adoption hurdles include, for example, potential resistance to the idea by retailers or partners. Because blue ocean strategies represent a significant departure from red oceans, it is key to address adoption hurdles up front.
How can you assess whether your blue ocean strategy is passing through each of the four sequential steps? And how can you refine your idea to pass each bar? Let's address these questions, starting with utility.
Testing for Exceptional Utility
The need to assess the buyer utility of your offering may seem selfevident. Yet many companies fail to deliver exceptional value because they are obsessed by the novelty of their product or service, especially if new technology plays a part in it.
Consider Philips' CD-1, an engineering marvel that failed to offer people a compelling reason to buy it. The player was promoted as the "Imagination Machine" because of its diverse functions. CD-i was a video machine, music system, game player, and teaching tool all wrapped into one. Yet it did so many different tasks that people could not understand how to use it. In addition, it lacked attractive software titles. So even though the CD-i theoretically could do almost anything, in reality it could do very little. Customers lacked a compelling reason to use it, and sales never took off.
Managers responsible for Philips' CD-i (as well as Motorola's Iridium) fell into the same trap: They reveled in the bells and whistles of their new technology. They acted on the assumption that bleeding-edge technology is equivalent to bleeding-edge utility for buyers something that, our research found, is rarely the case.
The technology trap that snagged Philips and Motorola trips up the best and brightest companies time and again. Unless the technology makes buyers' lives dramatically simpler, more convenient, more productive, less risky, or more fun and fashionable, it will not attract the masses no matter how many awards it wins. Think, for example, of Starbucks, Cirque du Soleil, The Home Depot, Southwest Airlines, [yellow tail], or Ralph Lauren: Value innovation is not the same as technology innovation.
To get around this trap, the starting point, as articulated in chapter 2, is to create a strategic profile that passes the initial lit mus test of being focused, being divergent, and having a compelling tagline that speaks to buyers. Having done this, companies are ready to expressly assess where and how the new product or service will change the lives of its buyers. Such a difference in perspective is important because it means that the way a product or service is developed becomes less a function of its technical possibilities and more a function of its utility to buyers.
The buyer utility map helps managers look at this issue from the right perspective (see figure 6-2). It outlines all the levers companies can pull to deliver exceptional utility to buyers as well as the various experiences buyers can have with a product or service. This map allows managers to identify the full range of utility spaces that a product or service can potentially fill. Let's look at the map's dimensions in detail.
FIGURE 6-2

The Buyer Utility Map
The Six Stages of the Buyer Experience Cycle
Purchase Delivery Use Supplements Maintenance Disposal
Customer
productivity
Simplicity
d
Convenience
Risk
y
m
Fun and
image
Environmental
friendliness
The Six Stages of the Buyer Experience Cycle
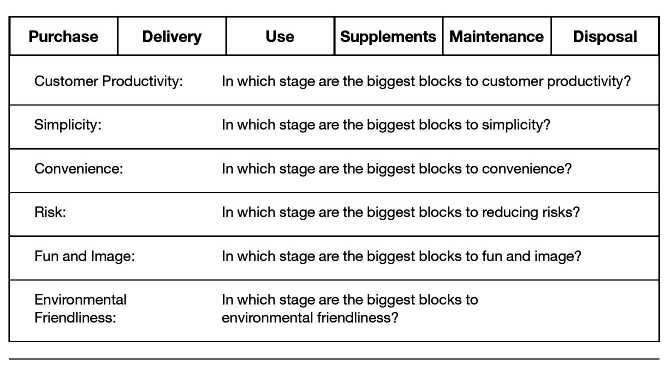
A buyer's experience can usually be broken into a cycle of six stages, running more or less sequentially from purchase to disposal. Each stage encompasses a wide variety of specific experiences. Purchasing, for example, may include the experience of browsing eBay as well as the aisles of The Home Depot. At each stage, managers can ask a set of questions to gauge the quality of buyers' experience, as described in figure 6-3.
The Six Utility Levers
Cutting across the stages of the buyer's experience are what we call utility levers: the ways in which companies can unlock exceptional utility for buyers. Most of the levers are obvious. Simplicity, fun and image, and environmental friendliness need little explanation. Nor does the idea that a product might reduce a customer's financial, physical, or credibility risks. And a product or service offers convenience simply by being easy to obtain, use, or dispose of. The most commonly used lever is that of customer productivity, in which an offering helps a customer do things faster or better.
To test for exceptional utility, companies should check whether their offering has removed the greatest blocks to utility across the entire buyer experience cycle for customers and noncustomers. The greatest blocks to utility often represent the greatest and most pressing opportunities to unlock exceptional value. Figure 6-4 shows how a company can identify the most compelling hot spots to unlock exceptional utility. By locating your proposed offering on the thirty-six spaces of the buyer utility map, you can clearly see how, and whether, the new idea not only creates a different utility proposition from existing offerings but also removes the biggest blocks to utility that stand in the way of converting noncustomers into customers. If your offering falls on the same space or spaces as those of other players, chances are it is not a blue ocean offering.


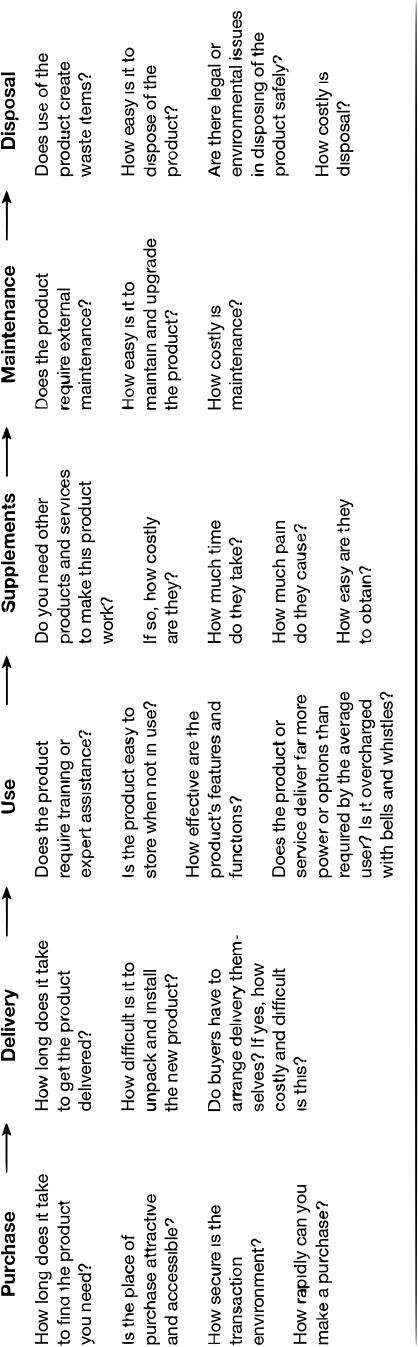
FIGURE 6-4

Uncovering the Blocks to Buyer Utility
Consider the Ford Model T. Before its debut, the more than five hundred automakers in the United States focused on building custommade luxury autos for the wealthy. In terms of the buyer utility map, the entire industry focused on image in the use phase, creating luxury cars for fashionable weekend outings. Only one of the thirty-six utility spaces was occupied.
The greatest blocks to utility for the mass of people, however, were not in refining the auto's luxury or stylish image. Rather, they had to do with two other factors. One was convenience in the use phase. The bumpy and muddy dirt roads that prevailed at the century's start were a natural for horses to tread over but often prevented finely crafted autos from passing. This significantly limited where and when cars could travel (driving on rainy and snowy days was ill advised), making the use of the car limited and inconvenient. The second block to utility was risk in the maintenance phase. The cars, being finely crafted and having multiple options, often broke down, requiring experts to fix them, and experts were expensive and in short supply.
In one fell swoop, Ford's Model T eliminated these two utility blocks. The Model T was called the car for the great multitude. It came in only one color (black) and one model, with scant options. In this way, Ford eliminated investments in image in the use phase. Instead of creating cars for weekends in the countryside -a luxury few could justify Ford's Model T was made for everyday use. It was reliable. It was durable; it was designed to travel effortlessly over dirt roads and in rain, sleet, or shine. It was easy to fix and use. People could learn to drive it in one day.
In this way the buyer utility map highlights the differences between ideas that genuinely create new and exceptional utility and those that are essentially revisions of existing offerings or technological breakthroughs not linked to value. The aim is to check whether your offering passes the exceptional utility test, as did the Model T. By applying this diagnostic, you can find out how your idea needs to be refined.
Where are the greatest blocks to utility across the buyer experience cycle for your customers and noncustomers? Does your offering effectively eliminate these blocks? If it does not, chances are your offering is innovation for innovation's sake or a revision of existing offerings. When a company's offering passes this test, it is ready to move to the next step.
From Exceptional Utility to Strategic Pricing
To secure a strong revenue stream for your offering, you must set the right strategic price. This step ensures that buyers not only will want to buy your offering but also will have a compelling ability to pay for it. Many companies take a reverse course, first testing the waters of a new product or service by targeting novelty-seeking, price-insensitive customers at the launch of a new business idea; only over time do they drop prices to attract mainstream buyers. It is increasingly important, however, to know from the start what price will quickly capture the mass of target buyers.
There are two reasons for this change. First, companies are discovering that volume generates higher returns than it used to. As the nature of goods becomes more knowledge intensive, companies bear much more of their costs in product development than in manufacturing. This is easy to understand in the software industry. Producing the first copy of the Windows XP operating system, for example, cost Microsoft billions of dollars, whereas subsequent copies involved no more than the nearly trivial cost of a CD. This makes volume key.
A second reason is that to a buyer, the value of a product or service may be closely tied to the total number of people using it. An example is the online auction service managed by eBay. People will not buy a product or service when it is used by few others. As a result of this phenomenon, called network externalities, many products and services are an all-or-nothing proposition: Either you sell millions at once, or you sell nothing at all.'
In the meantime, the rise of knowledge-intensive products also creates the potential for free riding. This relates to the nonrival and partially excludable nature of knowledge.2 The use of a rival good by one firm precludes its use by another. So, for example, Nobel Prize-winning scientists who are fully employed by IBM cannot simultaneously be employed by another company. Nor can scrap steel consumed by Nucor be simultaneously consumed for production by other minimill steel makers.
In contrast, the use of a nonrival good by one firm does not limit its use by another. Ideas fall into this category. So, for example, when Virgin Atlantic Airways launched its Upper Class brand -a new concept in business-class travel that essentially combined the huge seats and legroom of traditional first class with the price of business-class tickets other airlines were free to apply this idea to their own business-class service without limiting Virgin's ability to use it. This makes competitive imitation not only possible but less costly. The cost and risk of developing an innovative idea are borne by the initiator, not the follower.
This challenge is exacerbated when the notion of excludability is considered. Excludability is a function both of the nature of the good and of the legal system. A good is excludable if the company can prevent others from using it because of, for example, limited access or patent protection. Intel, for example, can exclude other microprocessor chipmakers from using its manufacturing facilities through property ownership laws. The women's fitness club Curves, however, cannot exclude someone from walking into any of its centers, studying its layout, atmosphere, and exercise routine, and mimicking its women's fitness concept: Women need only thirty minutes, three days a week, to get in shape while having fun with other women, with none of the usual embarrassment faced at gyms. The highest valueadded element of the Curves formula is not excludable. Once ideas are out there, knowledge naturally spills over to other firms.
This lack of excludability reinforces the risk of free riding. Like the creative and explosive concepts of Curves, Starbucks, or Southwest Airlines, many of the most powerful blue ocean ideas have tremendous value but in themselves consist of no new technological discoveries. As a result they are neither patentable nor excludable and hence are vulnerable to imitation.
All this means that the strategic price you set for your offering must not only attract buyers in large numbers but also help you to retain them. Given the high potential for free riding, an offering's reputation must be earned on day one, because brand building increasingly relies heavily on word-of-mouth recommendations spreading rapidly through our networked society. Companies must therefore start with an offer that buyers can't refuse and must keep it that way to discourage any freeriding imitations. This is what makes strategic pricing key. Strategic pricing addresses this question: Is your offering priced to attract the mass of target buyers from the start so that they have a compelling ability to pay for it? When exceptional utility is combined with strategic pricing, imitation is discouraged.
We have developed a tool called the price corridor of the mass to help managers find the right price for an irresistible offer, which, by the way, isn't necessarily the lower price. The tool involves two distinct but interrelated steps (see figure 6-5).
FIGURE 6-5

The Price Corridor of the Mass
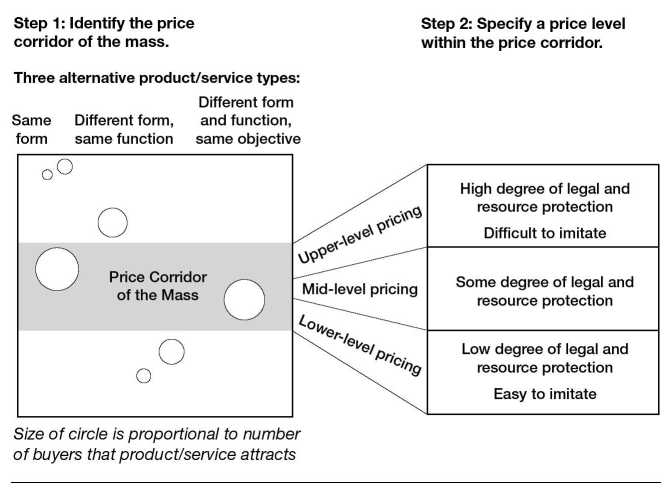
Step 1: Identify the Price Corridor of the Mass
In setting a price, all companies look first at the products and services that most closely resemble their idea in terms of form. Typically they look at other products and services within their industries. That's still a necessary exercise, of course, but it is not sufficient to attract new customers. So the main challenge in determining a strategic price is to understand the price sensitivities of those people who will be comparing the new product or service with a host of very different-looking products and services offered outside the group of traditional competitors.
A good way to look outside industry boundaries is to list products and services that fall into two categories: those that take different forms but perform the same function, and those that take different forms and functions but share the same overarching objective.
Different form, same function. Many companies that create blue oceans attract customers from other industries who use a product or service that performs the same function or bears the same core utility as the new one but takes a very different physical form. In the case of Ford's Model T, Ford looked to the horse-drawn carriage. The horse-drawn carriage had the same core utility as the car: transportation for individuals and families. But it had a very different form: a live animal versus a machine. Ford effectively converted the majority of noncustomers of the auto industry, namely customers of horse-drawn carriages, into customers of its own blue ocean by pricing its Model T against horse-drawn carriages and not the cars of other automakers.
In the case of the school lunch catering industry, raising this question led to an interesting insight. Suddenly those parents who make their children's lunches came into the equation. For many children, parents had the same function: making their child's lunch. But they had a very different form: mom or dad versus a lunch line in the cafeteria.
Different form and function, same objective. Some companies lure customers from even further away. Cirque du Soleil, for example, has diverted customers from a wide range of evening activities. Its growth came in part through drawing people away from other activities that differed in both form and function. For example, bars and restaurants have few physical features in common with a circus. They also serve a distinct function by providing conversational and gastronomical pleasure, a very different experience from the visual entertainment that a circus offers. Yet despite these differences in form and function, people have the same objective in undertaking these three activities: to enjoy a night out.
Listing the groups of alternative products and services allows managers to see the full range of buyers they can poach from other industries as well as from nonindustries, such as parents (for the school lunch catering industry) or the noble pencil in managing household finances (for the personal finance software industry). Having done this, managers should then graphically plot the price and volume of these alternatives, as shown in figure 6-5.
This approach provides a straightforward way to identify where the mass of target buyers is and what prices these buyers are prepared to pay for the products and services they currently use. The price bandwidth that captures the largest groups of target buyers is the price corridor of the mass.
In some cases, the range is very wide. For Southwest Airlines, for example, the price corridor of the mass covered the group of people paying, on average, $400 to buy an economy-class short-haul ticket to about $60 for the cost of going the same distance by car. The key here is not to pursue pricing against the competition within an industry but rather to pursue pricing against substitutes and alternatives across industries and nonindustries. Had Ford, for example, priced its Model T against other autos, which were more than three times the price of horse-drawn carriages, the market for the Model T would not have exploded.
Step 2: Specify a Level Within the Price Corridor
The second part of the tool helps managers determine how high a price they can afford to set within the corridor without inviting competition from imitation products or services. That assessment depends on two principal factors. First is the degree to which the product or service is protected legally through patents or copyrights. Second is the degree to which the company owns some exclusive asset or core capability, such as an expensive production plant, that can block imitation. Dyson, a British electrical white goods company, for example, has been able to charge a high unit price for its bagless vacuum cleaner since the product's launch in 1995, thanks to both strong patents and hard-to-imitate service capabilities.
Many other companies have used upper-boundary strategic pricing to attract the mass of target buyers. Examples include DuPont with its Lycra brand in specialty chemicals, Philips' ALTO in the professional lighting industry, SAP in the business application software industry, and Bloomberg in the financial software industry.
On the other hand, companies with uncertain patent and asset protection should consider pricing somewhere in the middle of the corridor. As for companies that have no such protection, they must set a relatively low price. In the case of Southwest Airlines, because its service wasn't patentable and required no exclusive assets, its ticket prices fell into the lower boundary of the corridor namely, against the price of car travel. Companies would be wise to pursue mid-to lower-boundary strategic pricing from the start if any of the following apply:
• Their blue ocean offering has high fixed costs and marginal variable costs.
• Their attractiveness depends heavily on network externalities.
• Their cost structure benefits from steep economies of scale and scope. In these cases, volume brings with it significant cost advantages, something that makes pricing for volume even more key.
The price corridor of the mass not only signals the strategic pricing zone central to pulling in an ocean of new demand but also signals how you might need to adjust your initial price estimates to achieve this. When your offering passes the test of strategic pricing, you're ready to move to the next step.
From Strategic Pricing to Target Costing
Target costing, the next step in the strategic sequence, addresses the profit side of the business model. To maximize the profit potential of a blue ocean idea, a company should start with the strategic price and then deduct its desired profit margin from the price to arrive at the target cost. Here, price-minus costing, and not cost-plus pricing, is essential if you are to arrive at a cost structure that is both profitable and hard for potential followers to match.
When target costing is driven by strategic pricing, however, it is usually aggressive. Part of the challenge of meeting the target cost is addressed in building a strategic profile that has not only divergence but also focus, which makes a company strip out costs. Think of the cost reductions Cirque du Soleil enjoyed by eliminating animals and stars or that Ford enjoyed by making the Model T in one color and one model having few options.
Sometimes these reductions are sufficient to hit the cost target, but often they are not. Consider the cost innovations that Ford had to introduce to meet its aggressive target cost for the Model T. Ford had to scrap the standard manufacturing system, in which cars were handmade by skilled craftsmen from start to finish. Instead, Ford introduced the assembly line, which replaced skilled craftsmen with ordinary unskilled laborers, who worked one small task faster and more efficiently, cutting the time to make a Model T from twenty-one days to four days and cutting labor hours by 60 percent.3 Had Ford not introduced these cost innovations, it could not have met its strategic price profitably.
Instead of drilling down and finding ways to creatively meet the target cost as Ford did, if companies give in to the tempting route of either bumping up the strategic price or cutting back on utility, they are not on the path to lucrative blue waters. To hit the cost target, companies have three principal levers.
The first involves streamlining operations and introducing cost innovations from manufacturing to distribution. Can the product's or service's raw materials be replaced by unconventional, less expensive ones such as switching from metal to plastic or shifting a call center from the U.K. to Bangalore? Can high-cost, low-valueadded activities in your value chain be significantly eliminated, reduced, or outsourced? Can the physical location of your product or service be shifted from prime real estate locations to lower-cost locations, as The Home Depot, IKEA, and Wal-Mart have done in retail or Southwest Airlines has done by shifting from major to secondary airports? Can you truncate the number of parts or steps used in production by shifting the way things are made, as Ford did by introducing the assembly line? Can you digitize activities to reduce costs?
By probing questions such as these, the Swiss watch company Swatch, for example, was able to arrive at a cost structure some 30 percent lower than any other watch company in the world. At the start, Nicolas Hayek, chairman of Swatch, set up a project team to determine the strategic price for the Swatch. At the time, cheap (about $75), high-precision quartz watches from Japan and Hong Kong were capturing the mass market. Swatch set the price at $40, a price at which people could buy multiple Swatches as fashion accessories. The low price left no profit margin for Japanese or Hong Kong-based companies to copy Swatch and undercut its price. Directed to sell the Swatch for that price and not a penny more, the Swatch project team worked backwards to arrive at the target cost, a process that involved determining the margin Swatch needed to support marketing and services and earn a profit.
Given the high cost of Swiss labor, Swatch was able to achieve this goal only by making radical changes in the product and production methods. Instead of using the more traditional metal or leather, for example, Swatch used plastic. Swatch's engineers also drastically simplified the design of the watch's inner workings, reducing the number of parts from one hundred fifty to fifty-one. Finally, the engineers developed new and cheaper assembly techniques; for example, the watch cases were sealed by ultrasonic welding instead of screws. Taken together, the design and manufacturing changes enabled Swatch to reduce direct labor costs from 30 percent to less than 10 percent of total costs. These cost innovations produced a cost structure that is hard to beat and let Swatch profitably dominate the mass market for watches, a market previously dominated by Asian manufacturers with a cheaper labor pool.
Beyond streamlining operations and introducing cost innovations, a second lever companies can pull to meet their target cost is partnering. In bringing a new product or service to market, many companies mistakenly try to carry out all the production and distribution activities themselves. Sometimes that's because they see the product or service as a platform for developing new capabilities. Other times it is simply a matter of not considering other out side options. Partnering, however, provides a way for companies to secure needed capabilities fast and effectively while dropping their cost structure. It allows a company to leverage other companies' expertise and economies of scale. Partnering includes closing gaps in capabilities through making small acquisitions when doing so is faster and cheaper, providing access to needed expertise that has already been mastered.
A large part of IKEA's ability to meet its target cost, for example, comes down to partnering. IKEA seeks out the lowest prices for materials and production via partnering with some fifteen hundred manufacturing companies in more than fifty countries to ensure it the lowest cost and fastest production of products in its IKEA lineup of some twenty thousand items.
Or consider German-based, world-leading business application software maker SAP By partnering with Oracle, SAP saved hundreds of millions if not billions of dollars in development costs and got a world-class central database, namely Oracle's, which sits at the heart of SAP's core products R/2 and R/3. SAP went a step further and also partnered with leading consulting firms, such as Capgemini and Accenture, to gain a global sales force overnight at no extra cost. Whereas Oracle had the fixed costs of a much smaller sales force on its balance sheet, SAP was able to leverage Capgemini's and Accenture's strong global networks to reach SAP's target customers, with no cost implication to the company.
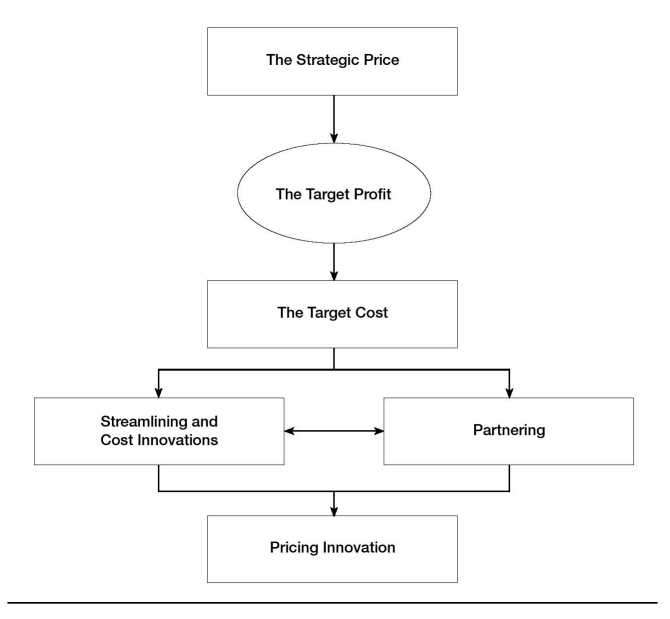
Sometimes, however, no amount of streamlining and cost innovation or partnering will make it possible for a company to deliver its target cost. This brings us to the third lever companies can use to make their desired profit margin without compromising their strategic price: changing the pricing model of the industry. By changing the pricing model used and not the level of the strategic price companies can often overcome this problem.
When film videotapes first came out, for example, they were priced at around $80. Few people were willing to pay that amount because no one expected to watch the video more than two or three times. The strategic price of a video had to be set in relation to going to the movies and not to owning a tape for life. So at $80 a tape, demand was not taking off. How could a company make money by selling the videos at only a few dollars if it followed the path of using strategic pricing? The answer was that it couldn't. Blockbuster, however, got around this problem by changing the pricing model from selling to renting. This allowed it to strategically price videotapes at only a few dollars per rental. The result was that the home video market exploded and Blockbuster made more money by repeatedly renting the same $80 videos than it could have by selling them outright. Similarly, IBM exploded the tabulating market by shifting the pricing model from selling to leasing to hit its strategic price while covering its cost structure.
In addition to Blockbuster's rental model or IBM's leasing model, companies have used several innovations in pricing models to profitably deliver on the strategic price. One model is the timeshare. The New Jersey company NetJets follows this model to make jets accessible to a wide range of corporate customers, who buy the right to use a jet for a certain amount of time rather than buy the jet itself. Another model is the slice-share; mutual fund managers, for example, bring high-quality portfolio services traditionally provided by private banks to the rich to the small investor by selling a sliver of the portfolio rather than its whole.
Some companies are abandoning the concept of price altogether. Instead, they give products to customers in return for an equity interest in the customer's business. HewlettPackard, for example, has traded high-powered servers to Silicon Valley start-ups for a share of their revenues. The customers get immediate access to a key capability, and HP stands to earn a lot more than the price of the machine. The aim is not to compromise on the strategic price but to hit the target through a new price model. We call this pricing innovation. Remember, however, that what is a pricing innovation for one industry, such as video rentals, is often a standard pricing model in another industry.
Figure 6-6 shows how value innovation typically maximizes profit by using the foregoing three levers. As the figure depicts, a company begins with its strategic price, from which it deducts its target profit margin to arrive at its target cost. To hit the cost target that supports that profit, companies have two key levers: One is streamlining and cost innovations, and the other is partnering. When the target cost cannot be met despite all efforts to build a low-cost business model, the company should turn to the third lever, pricing innovation, to profitably meet the strategic price. Of course, even when the target cost can be met, pricing innovation still can be pursued. When a company's offering successfully addresses the profit side of the business model, the company is ready to advance to the final step in the sequence of blue ocean strategy.
FIGURE 6-6

The Profit Model of Blue Ocean Strategy
A business model built in the sequence of exceptional utility, strategic pricing, and target costing produces value innovation. Unlike the practice of conventional technology innovators, value innovation is based on a win-win game among buyers, companies, and society. Appendix C, "The Market Dynamics of Value Innovation," illustrates how such a game is played out in the market and shows the economic and social welfare implications for its stakeholders.
From Utility, Price, and Cost to Adoption
Even an unbeatable business model may not be enough to guarantee the commercial success of a blue ocean idea. Almost by definition, it threatens the status quo, and for that reason it may provoke fear and resistance among a company's three main stakeholders: its employees, its business partners, and the general public. Before plowing forward and investing in the new idea, the company must first overcome such fears by educating the fearful.
Employees
Failure to adequately address the concerns of employees about the impact of a new business idea on their livelihoods can be expensive. When Merrill Lynch's management, for example, announced plans to create an online brokerage service, its stock price fell by 14 percent as reports emerged of resistance and infighting within the company's large retail brokerage division.
Before companies go public with an idea, they should make a concerted effort to communicate to employees that they are aware of the threats posed by the execution of the idea. Companies should work with employees to find ways of defusing the threats so that everyone in the company wins, despite shifts in people's roles, responsibilities, and rewards. In contrast to Merrill Lynch, Morgan Stanley Dean Witter & Co. engaged employees in an open internal discussion of the company's strategy for meeting the challenge of the Internet. Morgan's efforts paid off handsomely. Because the market realized that its employees understood the need for an e-venture, the company's shares rose 13 percent when it eventually announced the venture.
Business Partners
Potentially even more damaging than employee disaffection is the resistance of partners who fear that their revenue streams or market positions are threatened by a new business idea. That was the problem faced by SAP when it was developing its product AcceleratedSAP (ASAP), an enterprise software system that was fast to implement and hence low cost. ASAP brought business application software within the reach of midsized and small companies for the first time. The problem was that the development of best-practice templates for ASAP required the active cooperation of large consulting firms that were deriving substantial income from lengthy implementations of SAP's other products. As a result, they were not necessarily incentivized to find the fastest way to implement the company's software.
SAP resolved the dilemma by openly discussing the issues with its partners. Its executives convinced the consulting firms that they stood to gain more business by cooperating. Although ASAP would reduce implementation time for small and midsized companies, consultants would gain access to a new client base that would more than compensate for some lost revenues from larger companies. The new system would also offer consultants a way to respond to customers' increasingly vocal concerns that business application software took too long to implement.
The General Public
Opposition to a new business idea can also spread to the general public, especially if the idea is very new and innovative, threatening established social or political norms. The effects can be devas tating. Consider Monsanto, which makes genetically modified foods. Its intentions have been questioned by European consumers, largely because of the efforts of environmental groups such as Greenpeace, Friends of the Earth, and the Soil Association. The attacks of these groups have struck many chords in Europe, which has a history of environmental concern and powerful agricultural lobbies.
Monsanto's mistake was to let others take charge of the debate. The company should have educated the environmental groups as well as the public on the benefits of genetically modified food and its potential to eliminate world famine and disease. When the products came out, Monsanto should have given consumers a choice between organic and genetically modified foods by labeling which products had genetically modified seeds as their base. If Monsanto had taken these steps, then instead of being vilified, it might have ended up as the "Intel Inside" of food for the future the provider of the essential technology.
In educating these three groups of stakeholders your employees, your partners, and the general public the key challenge is to engage in an open discussion about why the adoption of the new idea is necessary. You need to explain its merits, set clear expectations for its ramifications, and describe how the company will address them. Stakeholders need to know that their voices have been heard and that there will be no surprises. Companies that take the trouble to have such a dialogue with stakeholders will find that it amply repays the time and effort involved. (For a fuller discussion of how companies can engage stakeholders, see chapter 8.)
The Blue Ocean Idea Index
Although companies should build their blue ocean strategy in the sequence of utility, price, cost, and adoption, these criteria form an integral whole to ensure commercial success. The blue ocean idea (BOI) index provides a simple but robust test of this system view (see Figure 6-7).
FIGURE 6-7

Blue Ocean Idea (BOI) Index
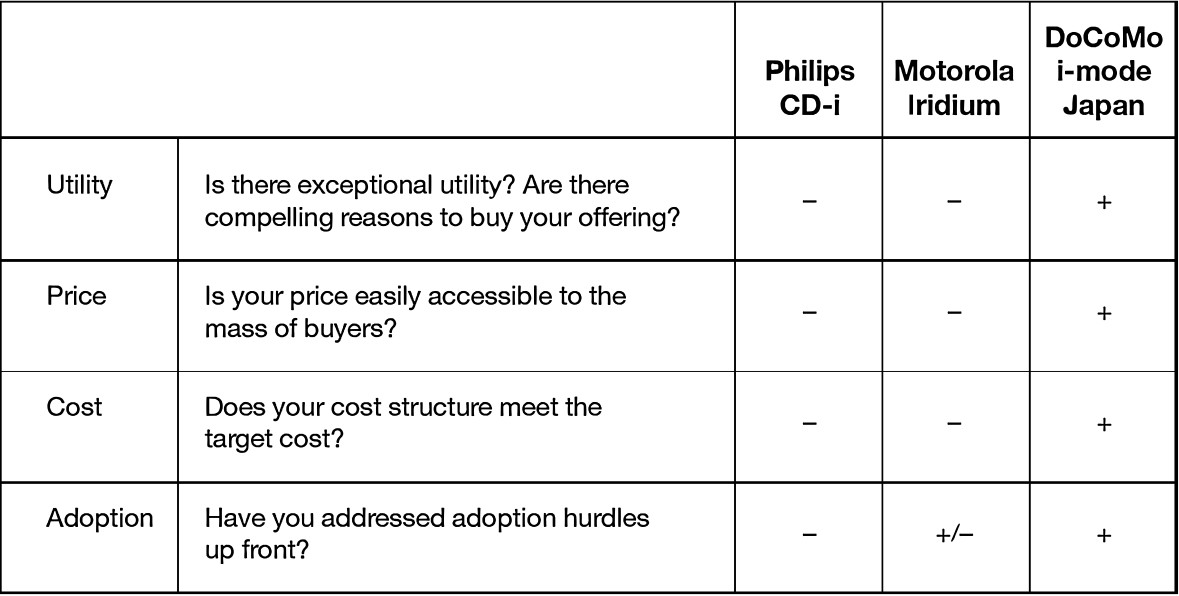
As shown in figure 6-7, had Philips' CD-i and Motorola's Iridium scored their ideas on the BOI index they would have seen how far they were from opening up lucrative blue oceans. With respect to Philips CD-1, it did not create exceptional buyer utility with its offering of complex technological functions and limited software titles. It was priced out of reach of the mass of buyers, and its manufacturing process was complicated and costly. With its complicated design, it took more than thirty minutes to explain and sell to customers, something that gave no incentive for sales clerks to sell CD-i in fast-moving retail. Philips CD-i therefore failed all four criteria on the BOI index despite the billions poured into it.
By assessing the business idea of the CD-i against the BOI index during development, Philips could have foreseen the shortcomings embedded in the idea and addressed them up front by simplifying the product and locking in partners to develop winning software titles, setting a strategic price accessible to the masses, instituting price-minus costing instead of cost-plus pricing, and working with retail to find a simple, easy way for the sales force to sell and explain the product in a few minutes.
Similarly, Motorola's Iridium was unreasonably expensive because of high production costs. It provided no attractive utility for the mass of buyers, not being usable in buildings or cars and being the size of a brick. When it came to adoption, Motorola overcame many regulations and secured transmission rights from numerous countries. Employees, partners, and the society were also reasonably motivated to accept the idea. But the company had a weak sales team and marketing channels in the global markets. Because Motorola was not able to follow up sales leads effectively, Iridium phone sets were sometimes unavailable when requested. Weak utility, price, and cost positions, plus average adoption ability, indicated that the Iridium idea would be a flop.
In contrast to these failures, consider NTT DoCoMo's i-mode launch in Japan. In 1999, when most telecom operators were focusing on technology races and price competition over voice-based wireless devices, NTT DoCoMo, the largest Japanese telecom operator, launched i-mode to offer the Internet on cell phones. Regular mobile telephony in Japan had reached a high level of sophistication in terms of mobility, quality of voice, ease of use, and hardware design. But it offered few databased services such as e-mail, access to information, news, and games, and transaction capabilities, which were the killer applications of the PCInternet world. The i-mode service brought together the key advantages of these two alternative industries the cell phone industry and the PCInternet industry and created unique and superior buyer utility.
The i-mode service offered exceptional buyer utility at a price accessible to the mass of buyers. The monthly i-mode subscription fee, the voice and data transmission fee, and the price of content were in the "nonreflection" strategic price zone, encouraging impulse buying and reaching the masses as quickly as possible. For example, the monthly subscription fee for a content site is between Y100 and Y300 ($1 and $3), which is the result of benchmarking against the price of the weekly magazines most Japanese regularly pick up at their train station kiosk.
After setting a price that was attractive to the mass of buyers, NTT DoCoMo strove to obtain the capabilities it needed to deliver the service within its cost target in order to turn a profit. In achieving this end, the company was never bounded by its own assets and capabilities. While it focused on its traditional role as an operator to develop and maintain a high-speed, high-capacity network in the i-mode project, it sought to deliver other key elements of its offering by actively partnering with handset manufacturers and information providers.
By creating a win-win partnership network, the company aimed to meet and sustain the target cost set by its strategic price. Although there are many partners and dimensions involved in its partnership network, a few aspects are particularly relevant here. First, NTT DoCoMo regularly and persistently shared know-how and technology with its handset manufacturing partners to help them stay ahead of their competitors. Second, the company played the role of the portal and gateway to the wireless network, expanding and updating the list of i-mode menu sites while attracting content providers to join the i-mode list and create the content that would boost user traffic. By handling the billing for the content providers with a small commission fee, for example, the company offered content providers major cost savings associated with billing system development. At the same time DoCoMo also obtained a growing revenue stream for itself.
More importantly, instead of using the Wireless Markup Language (WML) under the WAP standard for site creation, i-mode used c-HTML, an existing and already widely used language in Japan. This made i-mode more attractive to content providers because under c-HTML, software engineers needed no retraining to convert their existing Web sites, designed for the Internet environment, into sites for i-mode use, and thus they incurred no additional costs. NTT DoCoMo also entered into collaborative arrangements with key foreign partners, such as Sun Microsystems, Microsoft, and Symbian, to reduce the total development costs and shorten the time for an effective launch.
Another key aspect of the i-mode strategy was the way the project was carried out. A team specially dedicated to the project was set up and given a clear mandate and autonomy. The head of the i-mode team selected most of the team members and engaged them in an open discussion on how to create the new market of mobile data communications, making them committed to the project. All this created a favorable corporate environment for the adoption of i-mode. Moreover, the win-win game the company created for its partners, as well as the readiness of the Japanese general public to use database services, also contributed to the successful adoption of i-mode.
The i-mode service passed all four criteria on the BOI index, as shown earlier in figure 6-7. Indeed, i-mode turned out to be an explosive success. Six months after its launch, subscribers had reached the 1 million mark. Within two years, the number of subscribers had reached 21.7 million, and revenues from packet transmission alone had increased 130 times. By the end of 2003 the number of subscribers had reached 40.1 million, and revenues from the transmission of data, pictures, and text increased from 295 million yen ($2.6 million) to 886.3 billion yen ($8 billion).
DoCoMo is the only company that has been able to make money out of the mobile Internet. DoCoMo now exceeds its parent company, NTT, in terms of market capitalization as well as potential for profitable growth.
Although i-mode has been a huge success in Japan, its success outside Japan hinges on whether it can overcome regional adoption barriers of a regulatory, cultural, and emotional nature as well as those stemming from partnership dynamics and infrastructure economics.
Having passed the blue ocean idea index, companies are ready to shift gears from the formulation side of blue ocean strategy to its execution. The question is, How do you bring an organization with you to execute this strategy even though it often represents a significant departure from the past? This brings us to the second part of this book, and the fifth principle of blue ocean strategy: overcoming key organizational hurdles, the subject of our next chapter.
