7.7 Chart控件
其实,早在2007年Dundas就开发出收费的Chart控件,并以其强大的图表功能使该控件在业界得到了广泛的应用。而后在2008年9月,微软将该控件加以完善,并发布了免费的MSChart控件,主要应用在Microsoft.NET Framework 3.5SP1平台上。
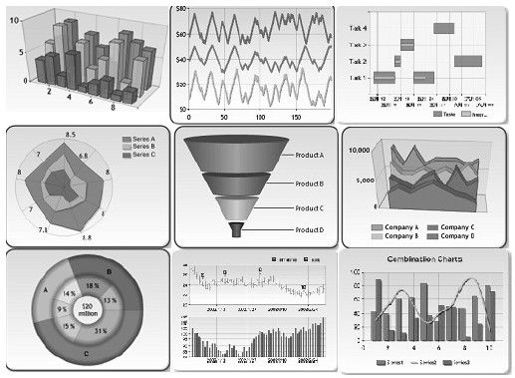
而在Microsoft.NET Framework 4中,为了更加方便广大开发者对MSChart控件的应用,微软已经将MSChart控件集成到Microsoft.NET Framework 4中。如图7-23所示,它不仅可以支持各种各样的图形显示,如常见的点状图、饼图、柱状图、曲线图、面积图、排列图等,并且,这些图形都支持3D样式的图表显示。除此之外,它支持图形上各个点的属性操作,它可以定义图形上各个点、标签、图形的提示信息((Toltip)以及超级链接、JavaScript动作等,而不是像其他图形类库仅生成一幅图片而已。通过这些,加上微软自己的AJAX框架,可以建立一个可以互动的图形统计报表。
现在,只要在配置文件Web.config中添加一个配置项,就可以像使用其他服务器控件一样使用Chart控件。配置代码如下所示:
<system.web>
<httpHandlers>
<add path="ChartImg.axd"verb="GET, HEAD"type=
"System.Web.UI.DataVisualization.Charting.ChartHttpHandler,
System.Web.DataVisualization, Version=4.0.0.0,
Culture=neutral, PublicKeyToken=31BF3856AD364E35"
validate="false"/>
</httpHandlers>
</system.web>
图 7-23 Chart控件常用图形
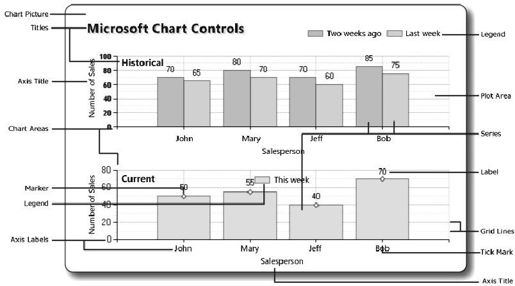
如图7-24所示,简单地讲,一个Chart控件图表包括如下几部分元素:
图 7-24 Chart控件图表组成元素
1)Annotations:它是一个对图形的一些注解对象的集合。所谓注解对象,类似于对某个点的详细或者批注的说明。例如,在图片上实现各个节点的关键信息。一个图形上可以拥有多个注解对象,可以通过标签添加多种图形样式的注解对象,包括常见的箭头、云朵、矩形、图片等13种注解符号,通过各个注解对象的属性,可以方便地设置注解对象的放置位置、呈现的颜色、大小、文字内容样式等常见的属性。如下面的示例代码所示:
<Annotations><asp:LineAnnotation Name="myLine"X="3"
Y="3"></asp:LineAnnotation></Annotations>
当然,也可以通过代码的形式来添加注解,如下面的代码所示:
LineAnnotation myLine=new LineAnnotation();
myLine.Name="myLine";
myLine.X=3;
myLine.Y=3;
Chart1.Annotations.Add(myLine);
2)BorderSkin:画布的边框风格。Chart控件内置了许多风格供你选择,设置示例如下面的代码所示:
<BorderSkin SkinStyle="Emboss"></BorderSkin>
3)ChartAreas:可以理解为一个图表的绘图区。例如,想在一幅图上呈现两个不同属性的内容,即一个是用户流量,另一个则是系统资源占用情况。那么要在一个图形上绘制这两种情况,明显是不合理的,对于这种情况,可以建立两个ChartArea,一个用于呈现用户流量,另一个则用于呈现系统资源的占用情况。
当然,Chart控件并不限制你添加多少个绘图区域,可以根据你的需要进行添加。对于每一个绘图区域,可以设置各自的属性,如X、Y轴属性和背景等。
需要注意的是,绘图区域只是一个可以作图的区域范围,它本身并不包含要作图形的各种属性数据。
4)Legends:它是一个图例的集合,即标注图形中各个线条或颜色的含义。同样,一个图片也可以包含多个图例说明。
5)Series:图表序列,应该是整个绘图中最关键的内容了。通俗点说,即是实际的绘图数据区域实际呈现的图形形状,就是由此集合中的每一个图表来构成的,可以往集合里面添加多个图表,每一个图表可以有自己的绘制形状、样式、独立的数据等。
需要注意的是,每一个图表,可以指定它的绘制区域,让此图表呈现在某个绘图区域,也可以让几个图表在同一个绘图区域叠加。
6)Titles:图表的标题配置,可以添加多个标题,以及设置标题的样式及文字、位置等属性。
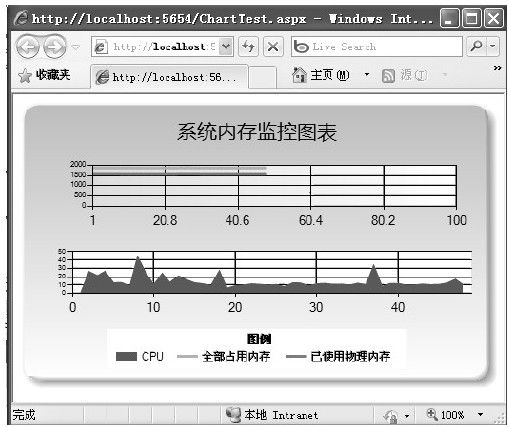
下面将通过Chart控件来完成一个计算机内存使用情况实时监控统计表。在这里,一共建立了两个绘图区,一个是用于呈现内存使用情况的,放置在ChartArea1区域;另一个则是呈现CPU使用情况的,放置在ChartArea2区域。一共有三个图表,分别表示已使用的物理内存、全部占用的物理内存、CPU使用显示的情况。
因为需要实时统计计算机内存的使用情况,所以需要用到AJAX控件来定时刷新图表。因此,除了Chart控件之外,还需要添加一个计时器以及AJAX的ScriptManager、UpdatePanel。把计时器和Chart控件都拖进UpdatePanel里面,设置计时器的间隔时间为1秒(1000)。如下面的代码所示:
<form id="form1"runat="server">
<asp:ScriptManager ID="ScriptManager1"runat="server">
</asp:ScriptManager>
<div>
<asp:UpdatePanel ID="UpdatePanel1"runat="server">
<ContentTemplate>
<asp:Timer ID="Timer1"runat="server"
OnTick="Timer1_Tick">
</asp:Timer>
<asp:Chart ID="ChartMemory"runat="server"
BackColor="LightSteelBlue"
BackGradientStyle="TopBottom"
BackSecondaryColor="White"EnableTheming="False"
EnableViewState="True"Height="300px"Width="500px">
<Legends>
<asp:Legend Alignment="Center"Docking="Bottom"
Name="Legend1"Title="图例">
</asp:Legend>
</Legends>
<BorderSkin SkinStyle="Emboss"/>
<Titles>
<asp:Title Font="微软雅黑,16pt"Name="Title1"
Text="系统内存监控图表">
</asp:Title>
</Titles>
<Series>
<asp:Series BorderColor="White"BorderWidth="3"
ChartArea="ChartArea1"ChartType="Spline"
Legend="Legend1"Name="已使用物理内存"
XValueType="Double"YValueType="Double">
</asp:Series>
<asp:Series BorderWidth="3"
ChartArea="ChartArea1"ChartType="Spline"
Legend="Legend1"Name="全部占用内存">
</asp:Series>
<asp:Series ChartArea="ChartArea2"
ChartType="StackedArea"Legend="Legend1"
Name="CPU">
</asp:Series>
</Series>
<ChartAreas>
<asp:ChartArea BackColor="224,224,224"
BackGradientStyle="LeftRight"
Name="ChartArea1">
</asp:ChartArea>
<asp:ChartArea Name="ChartArea2">
</asp:ChartArea>
</ChartAreas>
</asp:Chart>
</ContentTemplate>
</asp:UpdatePanel>
</div>
</form>
设计好页面之后,双击计时器,在它的Timer1_Tick事件里处理图标的绑定工作。如下面的代码所示:
using System;
using System.Collections.Generic;
using System.Data;
using System.Text;
using System.Web;
using System.Web.UI;
using System.Web.UI.WebControls;
using System.Web.UI.DataVisualization.Charting;
using System.Runtime.InteropServices;
using System.Diagnostics;
namespace_7_1
{
///<summary>
///取得计算机的系统信息
///</summary>
public class ComputerInfo
{
//取得Windows的目录
[DllImport("kernel32")]
public static extern void GetWindowsDirectory(
StringBuilder WinDir, int count);
//获取系统路径
[DllImport("kernel32")]
public static extern void GetSystemDirectory(
StringBuilder SysDir, int count);
//取得CPU信息
[DllImport("kernel32")]
public static extern void GetSystemInfo(
ref CPU_INFO cpuinfo);
//取得内存状态
[DllImport("kernel32")]
public static extern void GlobalMemoryStatus(
ref MEMORY_INFO meminfo);
//取得系统时间
[DllImport("kernel32")]
public static extern void GetSystemTime(
ref SYSTEMTIME_INFO stinfo);
public ComputerInfo()
{
}
}
//定义CPU的信息结构
[StructLayout(LayoutKind.Sequential)]
public struct CPU_INFO
{
public uint dwOemId;
public uint dwPageSize;
public uint lpMinimumApplicationAddress;
public uint lpMaximumApplicationAddress;
public uint dwActiveProcessorMask;
public uint dwNumberOfProcessors;
public uint dwProcessorType;
public uint dwAllocationGranularity;
public uint dwProcessorLevel;
public uint dwProcessorRevision;
}
//定义内存的信息结构
[StructLayout(LayoutKind.Sequential)]
public struct MEMORY_INFO
{
public uint dwLength;
public uint dwMemoryLoad;
public uint dwTotalPhys;
public uint dwAvailPhys;
public uint dwTotalPageFile;
public uint dwAvailPageFile;
public uint dwTotalVirtual;
public uint dwAvailVirtual;
}
//定义系统时间的信息结构
[StructLayout(LayoutKind.Sequential)]
public struct SYSTEMTIME_INFO
{
public ushort wYear;
public ushort wMonth;
public ushort wDayOfWeek;
public ushort wDay;
public ushort wHour;
public ushort wMinute;
public ushort wSecond;
public ushort wMilliseconds;
}
public partial class ChartTest:System.Web.UI.Page
{
protected void Page_Load(object sender, EventArgs e)
{
}
static PerformanceCounter pc=new
PerformanceCounter("Processor","%Processor Time","_Total");
protected void Timer1_Tick(object sender, EventArgs e)
{
MEMORY_INFO MemInfo=new MEMORY_INFO();
ComputerInfo.GlobalMemoryStatus(ref MemInfo);
//UseMemory
Series series=ChartMemory.Series[0];
int xCount=series.Points.Count==0?0:
series.Points.Count-1;
double lastXValue=series.Points.Count==0?1:
series.Points[xCount].XValue+1;
double lastYValue=((duble)((MmInfo.dwTotalPhys-
MemInfo.dwAvailPhys)/1024/1024;
series.Points.AddXY(lastXValue, lastYValue);
//Total Memory
series=ChartMemory.Series[1];
lastYValue=((duble)((MmInfo.dwTotalVirtual+
MemInfo.dwTotalPhys-MemInfo.dwAvailPhys-
MemInfo.dwAvailVirtual)/1024/1024;
series.Points.AddXY(lastXValue, lastYValue);
//CPU
series=ChartMemory.Series[2];
lastYValue=((duble)pc.NextValue();
series.Points.AddXY(lastXValue, lastYValue);
while(this.ChartMemory.Series[0].Points.Count>80)
{
foreach(Seriessin this.ChartMemory.Series)
{
s.Points.RemoveAt(0);
}
}
double axisMinimum=
this.ChartMemory.Series[0].Points[0].XValue;
this.ChartMemory.ChartAreas[0].AxisX.Minimum=
axisMinimum;
this.ChartMemory.ChartAreas[0].AxisX.Maximum=
axisMinimum+99;
}
}
}
这里需要说明的是,MEMORY_INFO和ComputerInfo是一个定义的结构体及调用Win32 API接口的一个访问类。程序分别取得每一个图表对象,每次加载的时候,都重新取得当前的内存和CPU信息,再在图表上添加一个点。所以,一定要设置图表控件的EnableViewState属性为True,否则无法记录状态。示例的运行结果如图7-25所示。
图 7-25 Chart控件示例运行结果
其实,Chart控件的功能还很多,使用范围也很广。由于篇幅的原因,这里就不再继续阐述,有兴趣的读者可以参考微软官方的示例与帮助文档进行学习。


