示例:USDA食品数据库
美国农业部(USDA)制作了一份有关食物营养信息的数据库。Ashley Williams(一名来自英国的技术牛人)制作了该数据的JSON版(http://ashleyw.co.uk/project/food-nutrient-database)。其中的记录如下所示:
- {
- "id": 21441,
- "description": "KENTUCKY FRIED CHICKEN, Fried Chicken, EXTRA CRISPY, Wing, meat and skin with breading",
- "tags": ["KFC"],
- "manufacturer": "Kentucky Fried Chicken",
- "group": "Fast Foods",
- "portions": [
- {
- "amount": 1,
- "unit": "wing, with skin",
- "grams": 68.0
- },
- ...
- ],
- "nutrients": [
- {
- "value": 20.8,
- "units": "g",
- "description": "Protein",
- "group": "Composition"
- },
- ...
- ]
- }
每种食物都带有若干标识性属性以及两个有关营养成分和分量的列表。这种形式的数据不是很适合分析工作,因此我们需要做一些规整化以使其具有更好用的形式。
从上面列举的那个网址下载并解压数据之后,你可以用任何喜欢的JSON库将其加载到Python中。我用的是Python内置的json模块:
- In [256]: import json
- In [257]: db = json.load(open('ch07/foods-2011-10-03.json'))
- In [258]: len(db)
- Out[258]: 6636
db中的每个条目都是一个含有某种食物全部数据的字典。nutrients字段是一个字典列表,其中的每个字典对应一种营养成分:
- In [259]: db[0].keys()
- Out[259]:
- [u'portions',
- u'description',
- u'tags',
- u'nutrients',
- u'group',
- u'id',
- u'manufacturer']
- In [260]: db[0]['nutrients'][0]
- Out[260]:
- {u'description': u'Protein',
- u'group': u'Composition',
- u'units': u'g',
- u'value': 25.18}
- In [261]: nutrients = DataFrame(db[0]['nutrients'])
- In [262]: nutrients[:7]
- Out[262]:
- description group units value
- 0 Protein Composition g 25.18
- 1 Total lipid (fat) Composition g 29.20
- 2 Carbohydrate, by difference Composition g 3.06
- 3 Ash Other g 3.28
- 4 Energy Energy kcal 376.00
- 5 Water Composition g 39.28
- 6 Energy Energy kJ 1573.00
在将字典列表转换为DataFrame时,可以只抽取其中的一部分字段。这里,我们将取出食物的名称、分类、编号以及制造商等信息:
- In [263]: info_keys = ['description', 'group', 'id', 'manufacturer']
- In [264]: info = DataFrame(db, columns=info_keys)
- In [265]: info[:5]
- Out[265]:
- description group id manufacturer
- 0 Cheese, caraway Dairy and Egg Products 1008
- 1 Cheese, cheddar Dairy and Egg Products 1009
- 2 Cheese, edam Dairy and Egg Products 1018
- 3 Cheese, feta Dairy and Egg Products 1019
- 4 Cheese, mozzarella, part skim milk Dairy and Egg Products 1028
- In [266]: info
- Out[266]:
- <class 'pandas.core.frame.DataFrame'>
- Int64Index: 6636 entries, 0 to 6635
- Data columns:
- description 6636 non-null values
- group 6636 non-null values
- id 6636 non-null values
- manufacturer 5195 non-null values
- dtypes: int64(1), object(3)
通过value_counts,你可以查看食物类别的分布情况:
- In [267]: pd.value_counts(info.group)[:10]
- Out[267]:
- Vegetables and Vegetable Products 812
- Beef Products 618
- Baked Products 496
- Breakfast Cereals 403
- Legumes and Legume Products 365
- Fast Foods 365
- Lamb, Veal, and Game Products 345
- Sweets 341
- Pork Products 328
- Fruits and Fruit Juices 328
现在,为了对全部营养数据做一些分析,最简单的办法是将所有食物的营养成分整合到一个大表中。我们分几个步骤来实现该目的。首先,将各食物的营养成分列表转换为一个DataFrame,并添加一个表示编号的列,然后将该DataFrame添加到一个列表中。最后通过concat将这些东西连接起来就可以了:
- nutrients = []
- for rec in db:
- fnuts = DataFrame(rec['nutrients'])
- fnuts['id'] = rec['id']
- nutrients.append(fnuts)
- nutrients = pd.concat(nutrients, ignore_index=True)
如果一切顺利的话,nutrients应该是下面这样的:
- In [269]: nutrients
- Out[269]:
- <class 'pandas.core.frame.DataFrame'>
- Int64Index: 389355 entries, 0 to 389354
- Data columns:
- description 389355 non-null values
- group 389355 non-null values
- units 389355 non-null values
- value 389355 non-null values
- id 389355 non-null values
- dtypes: float64(1), int64(1), object(3)
我发现这个DataFrame中无论如何都会有一些重复项,所以直接丢弃就可以了:
- In [270]: nutrients.duplicated().sum()
- Out[270]: 14179
- In [271]: nutrients = nutrients.drop_duplicates()
由于两个DataFrame对象中都有"group"和"description",所以为了明确到底谁是谁,我们需要对它们进行重命名:
- In [272]: col_mapping = {'description' : 'food',
- ...: 'group' : 'fgroup'}
- In [273]: info = info.rename(columns=col_mapping, copy=False)
- In [274]: info
- Out[274]:
- <class 'pandas.core.frame.DataFrame'>
- Int64Index: 6636 entries, 0 to 6635
- Data columns:
- food 6636 non-null values
- fgroup 6636 non-null values
- id 6636 non-null values
- manufacturer 5195 non-null values
- dtypes: int64(1), object(3)
- In [275]: col_mapping = {'description' : 'nutrient',
- ...: 'group' : 'nutgroup'}
- In [276]: nutrients = nutrients.rename(columns=col_mapping, copy=False)
- In [277]: nutrients
- Out[277]:
- <class 'pandas.core.frame.DataFrame'>
- Int64Index: 375176 entries, 0 to 389354
- Data columns:
- nutrient 375176 non-null values
- nutgroup 375176 non-null values
- units 375176 non-null values
- value 375176 non-null values
- id 375176 non-null values
- dtypes: float64(1), int64(1), object(3)
做完这些事情之后,就可以将info跟nutrients合并起来:
- In [278]: ndata = pd.merge(nutrients, info, on='id', how='outer')
- In [279]: ndata
- Out[279]:
- <class 'pandas.core.frame.DataFrame'>
- Int64Index: 375176 entries, 0 to 375175
- Data columns:
- nutrient 375176 non-null values
- nutgroup 375176 non-null values
- units 375176 non-null values
- value 375176 non-null values
- id 375176 non-null values
- food 375176 non-null values
- fgroup 375176 non-null values
- manufacturer 293054 non-null values
- dtypes: float64(1), int64(1), object(6)
- In [280]: ndata.ix[30000]
- Out[280]:
- nutrient Folic acid
- nutgroup Vitamins
- units mcg
- value 0
- id 5658
- food Ostrich, top loin, cooked
- fgroup Poultry Products
- manufacturer
- Name: 30000
接下来的两章中将介绍切片和切块、聚合、图形化方面的工具,所以在你掌握了那些方法之后可以再用这个数据集来练练手。比如说,我们可以根据食物分类和营养类型画出一张中位值图(如图7-1所示):
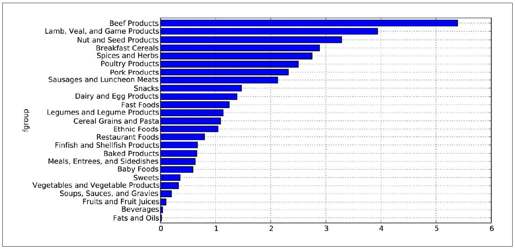
图7-1:根据营养分类得出的锌中位值
- In [281]: result = ndata.groupby(['nutrient', 'fgroup'])['value'].quantile(0.5)
- In [282]: result['Zinc, Zn'].order().plot(kind='barh')
只要稍微动一动脑子,就可以发现各营养成分最为丰富的食物是什么了:
- by_nutrient = ndata.groupby(['nutgroup', 'nutrient'])
- get_maximum = lambda x: x.xs(x.value.idxmax())
- get_minimum = lambda x: x.xs(x.value.idxmin())
- max_foods = by_nutrient.apply(get_maximum)[['value', 'food']]
- # 让food小一点
- max_foods.food = max_foods.food.str[:50]
由于得到的DataFrame很大,所以不方便在书里面全部打印出来。这里只给出"Amino Acids"营养分组:
- In [284]: max_foods.ix['Amino Acids']['food']
- Out[284]:
- nutrient
- Alanine Gelatins, dry powder, unsweetened
- Arginine Seeds, sesame flour, low-fat
- Aspartic acid Soy protein isolate
- Cystine Seeds, cottonseed flour, low fat (glandless)
- Glutamic acid Soy protein isolate
- Glycine Gelatins, dry powder, unsweetened
- Histidine Whale, beluga, meat, dried (Alaska Native)
- Hydroxyproline KENTUCKY FRIED CHICKEN, Fried Chicken, ORIGINAL R
- Isoleucine Soy protein isolate, PROTEIN TECHNOLOGIES INTERNA
- Leucine Soy protein isolate, PROTEIN TECHNOLOGIES INTERNA
- Lysine Seal, bearded (Oogruk), meat, dried (Alaska Nativ
- Methionine Fish, cod, Atlantic, dried and salted
- Phenylalanine Soy protein isolate, PROTEIN TECHNOLOGIES INTERNA
- Proline Gelatins, dry powder, unsweetened
- Serine Soy protein isolate, PROTEIN TECHNOLOGIES INTERNA
- Threonine Soy protein isolate, PROTEIN TECHNOLOGIES INTERNA
- Tryptophan Sea lion, Steller, meat with fat (Alaska Native)
- Tyrosine Soy protein isolate, PROTEIN TECHNOLOGIES INTERNA
- Valine Soy protein isolate, PROTEIN TECHNOLOGIES INTERNA
- Name: food
