透视表和交叉表
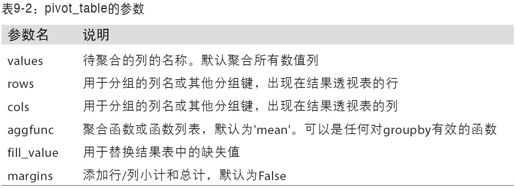
透视表(pivot table)是各种电子表格程序和其他数据分析软件中一种常见的数据汇总工具。它根据一个或多个键对数据进行聚合,并根据行和列上的分组键将数据分配到各个矩形区域中。在Python和pandas中,可以通过本章所介绍的groupby功能以及(能够利用层次化索引的)重塑运算制作透视表。DataFrame有一个pivot_table方法,此外还有一个顶级的pandas.pivot_table函数。除能为groupby提供便利之外,pivot_table还可以添加分项小计(也叫做margins)。
回到小费数据集,假设我想要根据sex和smoker计算分组平均数(pivot_table的默认聚合类型),并将sex和smoker放到行上:
- In [142]: tips.pivot_table(rows=['sex', 'smoker'])
- Out[142]:
- size tip tip_pct total_bill
- sex smoker
- Female No 2.592593 2.773519 0.156921 18.105185
- Yes 2.242424 2.931515 0.182150 17.977879
- Male No 2.711340 3.113402 0.160669 19.791237
- Yes 2.500000 3.051167 0.152771 22.284500
这对groupby来说也是很简单的事情。现在,假设我们只想聚合tip_pct和size,而且想根据day进行分组。我将smoker放到列上,把day放到行上:
- In [143]: tips.pivot_table(['tip_pct', 'size'], rows=['sex', 'day'],
- ...: cols='smoker')
- Out[143]:
- tip_pct size
- smoker No Yes No Yes
- sex day
- Female Fri 0.165296 0.209129 2.500000 2.000000
- Sat 0.147993 0.163817 2.307692 2.200000
- Sun 0.165710 0.237075 3.071429 2.500000
- Thur 0.155971 0.163073 2.480000 2.428571
- Male Fri 0.138005 0.144730 2.000000 2.125000
- Sat 0.162132 0.139067 2.656250 2.629630
- Sun 0.158291 0.173964 2.883721 2.600000
- Thur 0.165706 0.164417 2.500000 2.300000
还可以对这个表作进一步的处理,传入margins=True添加分项小计。这将会添加标签为All的行和列,其值对应于单个等级中所有数据的分组统计。在下面这个例子中,All值为平均数:不单独考虑烟民与非烟民(All列),不单独考虑行分组两个级别中的任何单项(All行)。
- In [144]: tips.pivot_table(['tip_pct', 'size'], rows=['sex', 'day'],
- ...: cols='smoker', margins=True)
- Out[144]:
- size tip_pct
- smoker No Yes All No Yes All
- sex day
- Female Fri 2.500000 2.000000 2.111111 0.165296 0.209129 0.199388
- Sat 2.307692 2.200000 2.250000 0.147993 0.163817 0.156470
- Sun 3.071429 2.500000 2.944444 0.165710 0.237075 0.181569
- Thur 2.480000 2.428571 2.468750 0.155971 0.163073 0.157525
- Male Fri 2.000000 2.125000 2.100000 0.138005 0.144730 0.143385
- Sat 2.656250 2.629630 2.644068 0.162132 0.139067 0.151577
- Sun 2.883721 2.600000 2.810345 0.158291 0.173964 0.162344
- Thur 2.500000 2.300000 2.433333 0.165706 0.164417 0.165276
- All 2.668874 2.408602 2.569672 0.159328 0.163196 0.160803
要使用其他的聚合函数,将其传给aggfunc即可。例如,使用count或len可以得到有关分组大小的交叉表:
- In [145]: tips.pivot_table('tip_pct', rows=['sex', 'smoker'], cols='day',
- ...: aggfunc=len, margins=True)
- Out[145]:
- day Fri Sat Sun Thur All
- sex smoker
- Female No 2 13 14 25 54
- Yes 7 15 4 7 33
- Male No 2 32 43 20 97
- Yes 8 27 15 10 60
- All 19 87 76 62 244
如果存在空的组合(也就是NA),你可能会希望设置一个fill_value:
- In [146]: tips.pivot_table('size', rows=['time', 'sex', 'smoker'],
- ...: cols='day', aggfunc='sum', fill_value=0)
- Out[146]:
- day Fri Sat Sun Thur
- time sex smoker
- Dinner Female No 2 30 43 2
- Yes 8 33 10 0
- Male No 4 85 124 0
- Yes 12 71 39 0
- Lunch Female No 3 0 0 60
- Yes 6 0 0 17
- Male No 0 0 0 50
- Yes 5 0 0 23
pivot_table的参数说明请参见表9-2。
交叉表:crosstab
交叉表(cross-tabulation,简称crosstab)是一种用于计算分组频率的特殊透视表。下面这个范例数据很典型,取自交叉表的Wikipedia页:
- In [150]: data
- Out[150]:
- Sample Gender Handedness
- 0 1 Female Right-handed
- 1 2 Male Left-handed
- 2 3 Female Right-handed
- 3 4 Male Right-handed
- 4 5 Male Left-handed
- 5 6 Male Right-handed
- 6 7 Female Right-handed
- 7 8 Female Left-handed
- 8 9 Male Right-handed
- 9 10 Female Right-handed
假设我们想要根据性别和用手习惯对这段数据进行统计汇总。虽然可以用pivot_table实现该功能,但是pandas.crosstab函数会更方便:
- In [151]: pd.crosstab(data.Gender, data.Handedness, margins=True)
- Out[151]:
- Handedness Left-handed Right-handed All
- Gender
- Female 1 4 5
- Male 2 3 5
- All 3 7 10
crosstab的前两个参数可以是数组、Series或数组列表。再比如对小费数据集:
- In [152]: pd.crosstab([tips.time, tips.day], tips.smoker, margins=True)
- Out[152]:
- smoker No Yes All
- time day
- Dinner Fri 3 9 12
- Sat 45 42 87
- Sun 57 19 76
- Thur 1 0 1
- Lunch Fri 1 6 7
- Thur 44 17 61
- All 151 93 244
